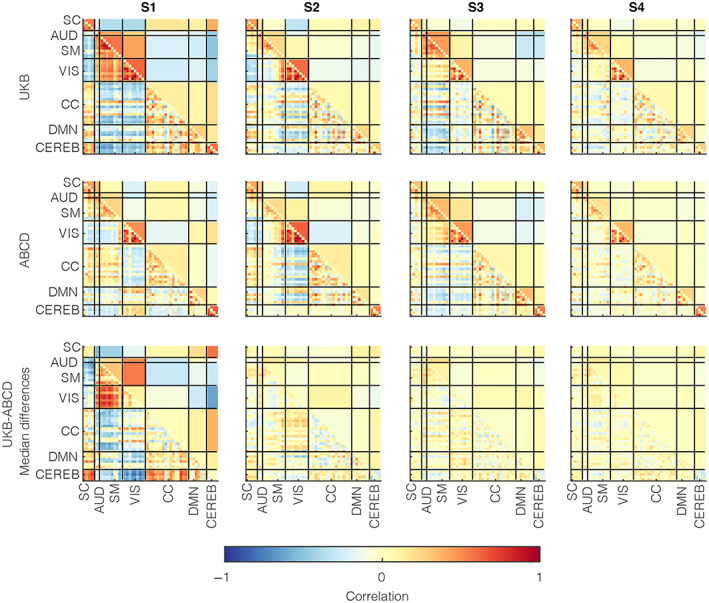
FIGURE 3.

Group differences in time‐resolved functional network connectivity (trFNC) state patterns with unilateral clustering. We assessed the group‐level median patterns from the subject‐level median patterns in the trFNC state patterns. This figure demonstrates the group‐level data for adults (UK Biobank [UKB] subjects) in the top row and adolescents (Adolescent Brain Cognitive Development [ABCD] subjects) in the middle panel. In contrast, we plot the patterns in their group differences (UKB‐ABCD) in the bottom row. Consistent with previous results, the most contrastive pattern between the two groups is presented in the S1 brain state profile, though other states also differ marginally. Vertical and horizontal black lines partition the brain state patterns by (n = 7) domains based on anatomical and functional properties of the (n = 53) brain components: AUD, Auditory; CC, Cognitive control; CEREB, Cerebellum; DMN, Default mode network; SC, Subcortical; SM, Somatomotor; VIS, Visual
