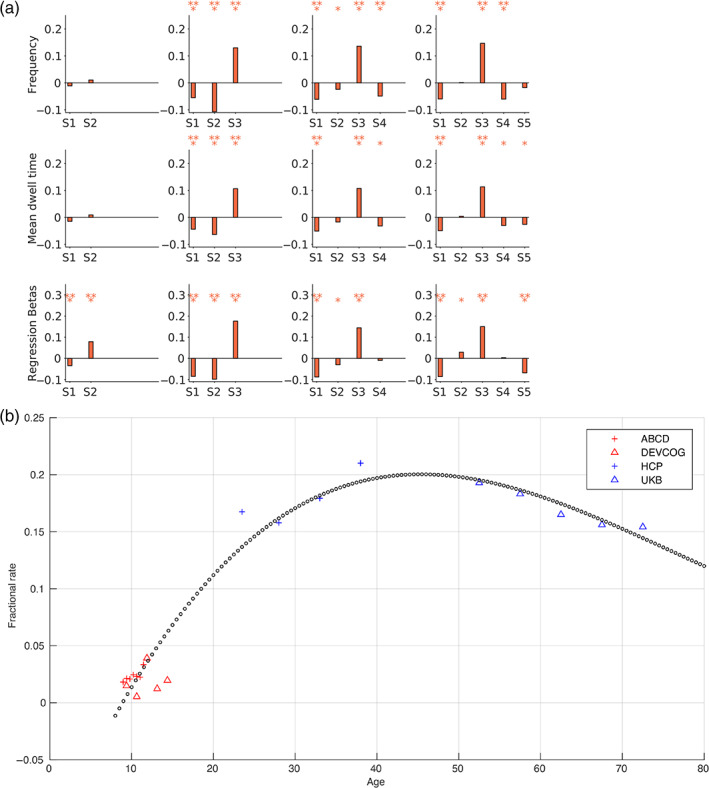
FIGURE 9.

Association of dynamic metrics with age in pooled clustering. (a) We computed the fractional occupancy rates (frequency), the mean dwell times, and regression beta metrics for UK Biobank subjects for a range of clustering model orders (k = 2–5). This figure plots the Pearson's correlation of age with the considered three clustering metrics for all trFNC brains state patterns (S1: State 1, S2: State 2, S3: State 3, S4: State 4, and S5: State 5). The statistical significance of these associations is tested at two significance levels ‐ marked as * for α = .05 and ** for α = .05/m (Bonferroni correction for multiple comparisons, where m = 42 tests, comparing three metrics in states). The dominant adult state pattern (S1) presented a statistically significant negative association with age in adults across model orders k = 3–5. (b) Polynomial curve fitting for the optimal model order (k = 4) indicates an overall positively skewed inverted U‐shaped association with age for the most contrastive brain pattern.
