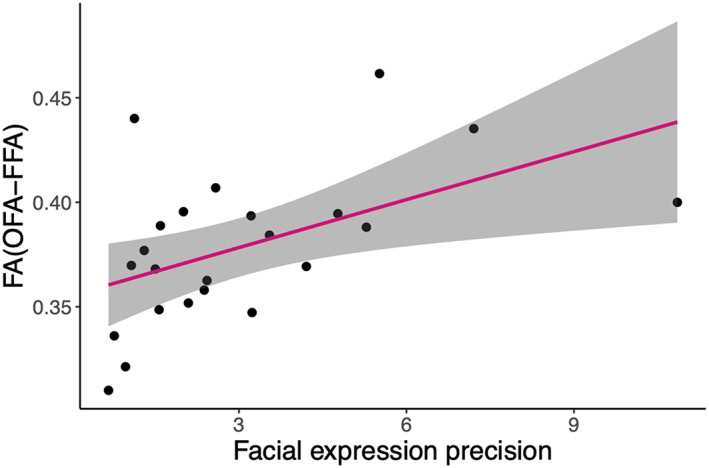
FIGURE 6.

Relationship between facial expression precision and fractional anisotropy (FA)(OFA–FFA). There was a significant correlation between facial expression precision and FA of occipital face area–fusiform face area (OFA–FFA) tracts (r s = .5526, p = .006). Each point represents one observer. The 95% confidence interval is shown with grey shading.
