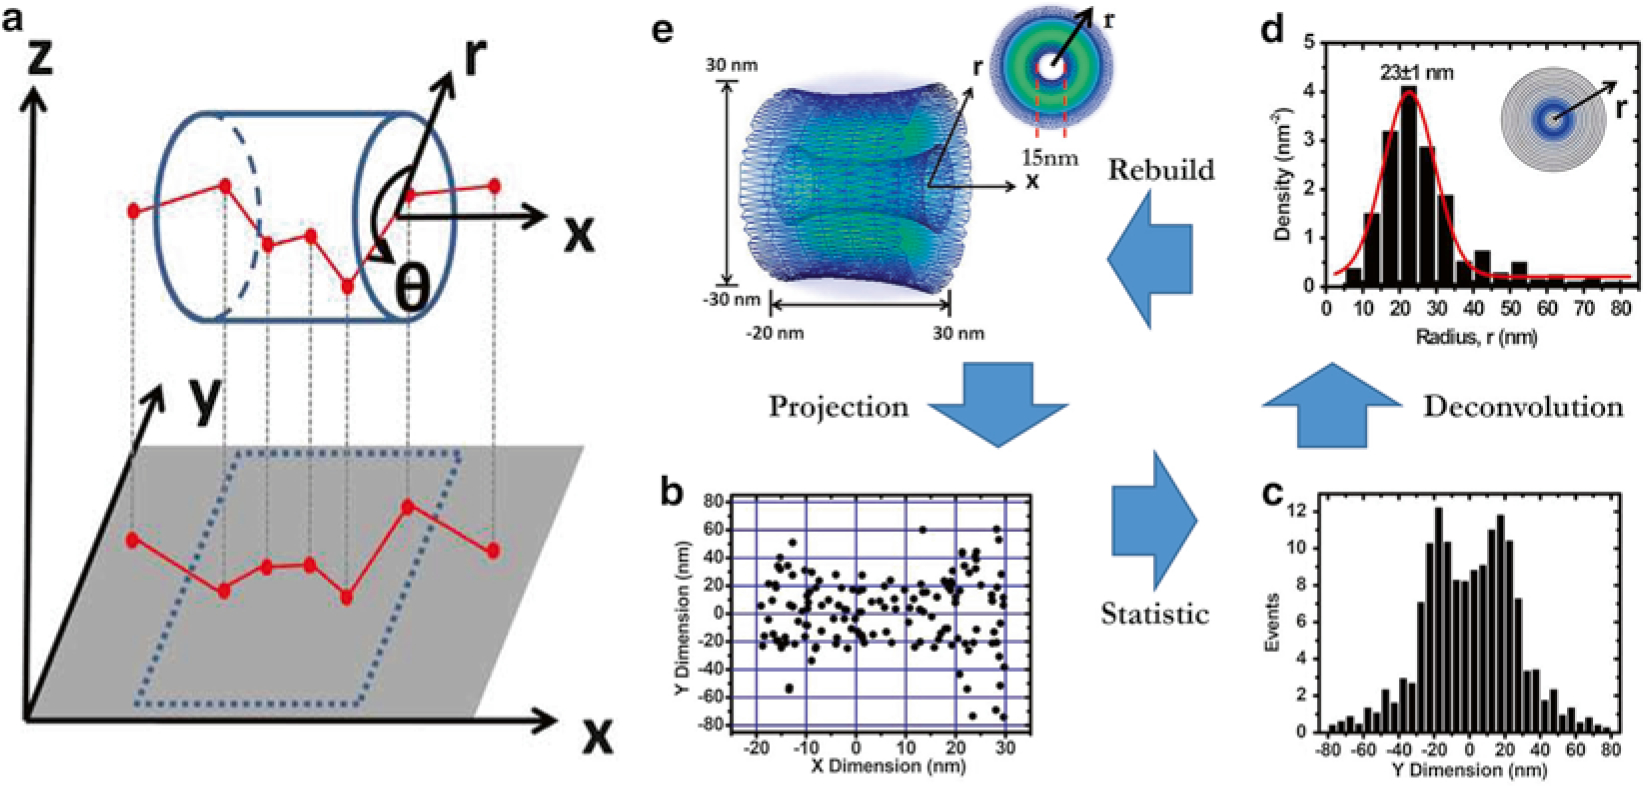
Fig. 4.

Diagram of the 2D to 3D deconvolution process [18]. (a) A diagram to show that the obtained 2D spatial locations of Imp β1 are a projection effect of the actual 3D spatial locations of Imp β1 in the xy plane. (b) Two-dimensional spatial locations of Imp β1 in the central scaffold region of the NPC. (c) Histogram of Imp β1 locations in the central scaffold region in the y-dimension. (Bin size, 5 nm.) (d) The obtained histogram of spatial densities along the radius (r) at the cross section of NPC in the central scaffold. The radii were used to plot concentric rings. The darker the ring, the higher the density. (Bin size, 5 nm.) (e) The obtained 3D spatial densities of Imp β1 (blue shaded region and isolated surface lines, brighter green color indicates higher density) in the central pore
