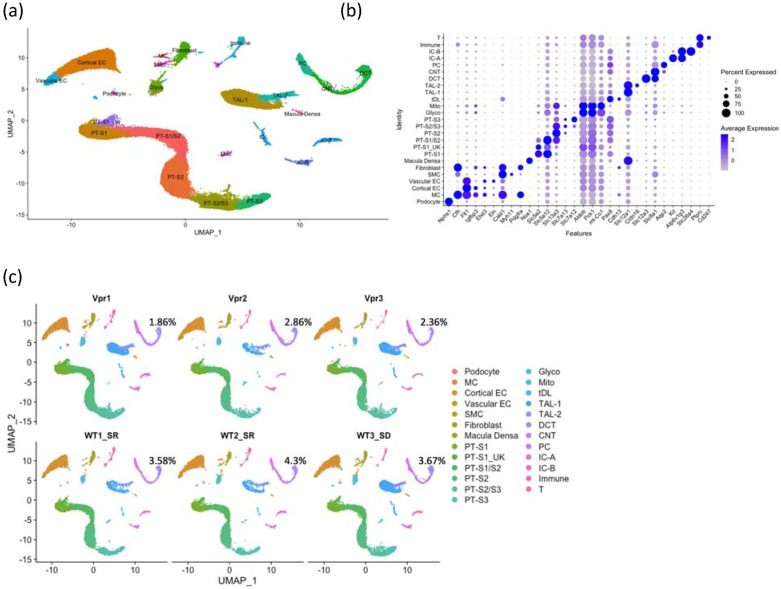
Figure 1. snRNA-seq of mouse kidney cortex samples.
(a) UMAP projection of 10x datasets from six samples after anchor-based integration.
(b) Dot plot showing the marker genes to identify the cell type in each cluster: podocyte; mesangial cell (MC); cortical endothelial cell (Cortical EC); vascular endothelial cell (Vascular EC); smooth muscle cell (SMC); fibroblast; macula densa; proximal tubule, S1 segment (PT-S1); proximal tubule, S1 segment of unknown subtype (PT-S1_UK); proximal tubule, S1 and S2 segments (PT-S1/S2); proximal tubule, S2 segment (PT-S2); proximal tubule, S2 and S3 segments (PT-S2/S3); proximal tubule, S3 segment (PT-S3); Cells enriched in glycolytic enzymes (Glyco); Cells enriched in mitochondrial transcripts (Mito); thin descending limb (tDL); thick ascending limb 1 (TAL-1); thick ascending limb 2 (TAL-2); distal convoluted tubule (DCT); connecting tubule (CNT); principal cell (PC); type A intercalated cell(IC-A); type B intercalated cell (IC-B); immune cell (Immune); T cell (T).
(c) UMAP projections of individual sample showing the percentages of DCT cells to overall cells in each sample.

