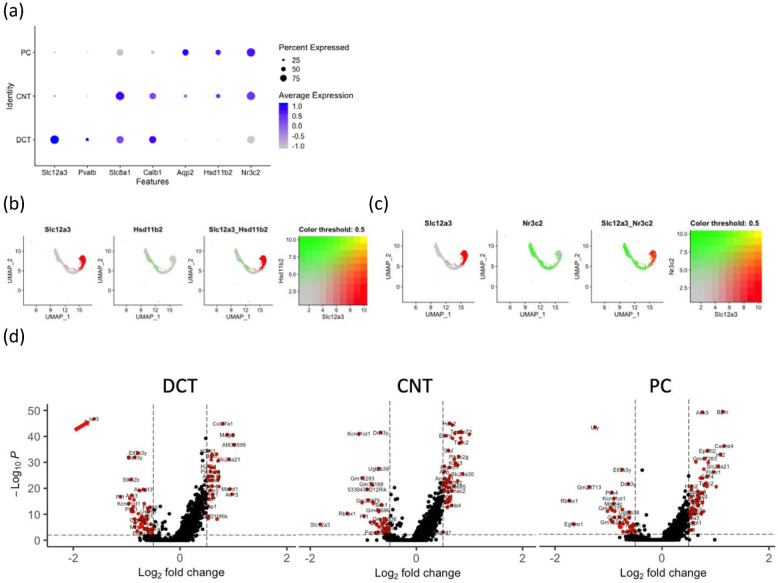
Figure 2. Expression pattern of Slc12a3, Nr3c2, Hsd11b2 and other genes across distal tubular clusters.
(a) Dot plot showing the expression of genes distinguishing distal tubular cell types.
(b) Feature plots of individual samples showing the expression overlap between Slc12a3 and Hsd11b2.
(c) Feature plots showing the overlap of expression between Slc12a3 and Nr3c2.
(d) Volcano plots showing differentially expressed genes in DCT, CNT and PC clusters. Red arrow indicates Ier3 downregulation in DCT cluster.

