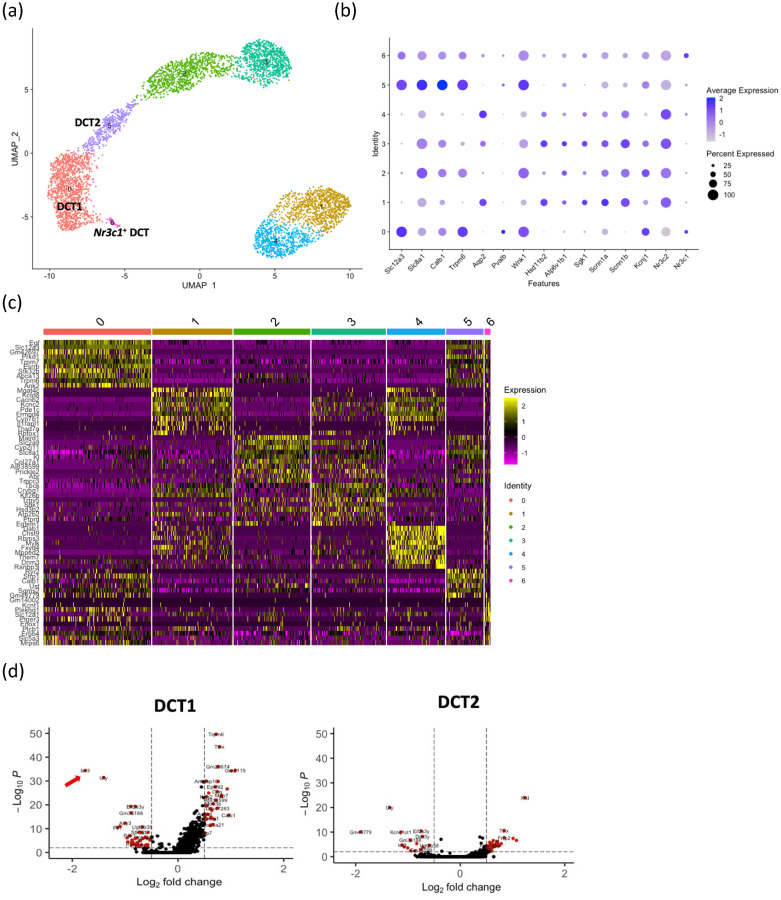
Figure 4. Subclustering of distal tubule clusters (DCT, CNT and PC).
(a) UMAP plot showing 7 subclusters.
(b) Dot plot showing marker genes to identify sub-populations of distal tubular cells.
(c) Heatmap showing the ten highly expressed genes in each subcluster compared to all remaining subclusters.
(d) Volcano plots showing downregulation of Ier3 gene in DCT1 but not in DCT2 subcluster.

