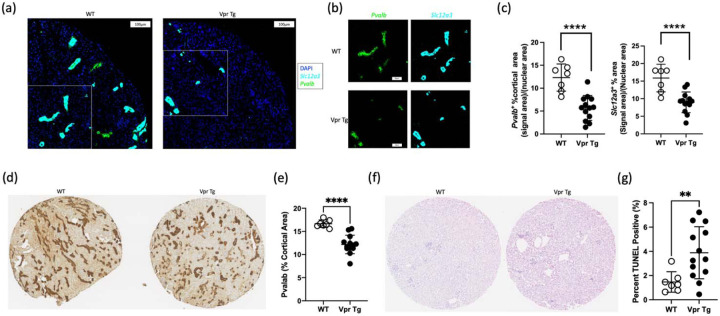
Figure 5. Imaging results of WT and Vpr Tg kidney cortex samples.
(a) RNAScope images of a quarter of a tissue microarray section showing that Vpr mice had less Slc12a3 and Pvalb fluorescence signals than WT mice.
(b) Areas of images from Figure 5a marked by the white rectangles showing individual genes for Pvalb and Slc12a3.
(c) Dot plots showing unpaired t-tests comparing the cortical areas positive for fluorescence signals of Pvalb and Slc12a3 between WT and Vpr Tg mice.
(d) Tissue microarray sections showing reduced parvalbumin (Pvalb) staining in Vpr Tg mice compared to WT
(e) Dot plot of the unpaired t-test comparing parvalbumin (+) cortical area between seven WT mouse and thirteen Vpr Tg mouse samples.
(f) Tissue microarray sections showing TUNEL staining of WT and Vpr Tg samples.
(g) Dot plot showing the results of MannWhitney U test comparing the percent of TUNEL (+) nuclei between WT and Vpr Tg samples. The Pvalb and TUNEL values of each sample on Y-axis were average values from triplicates.

