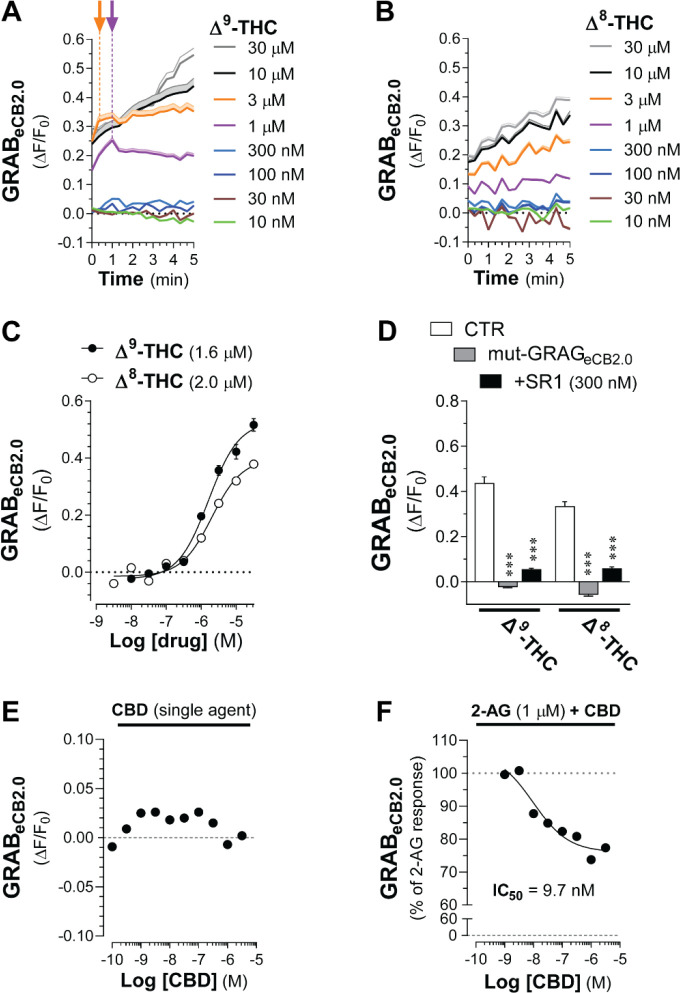
Figure 4: Δ9-THC and Δ8-THC activate GRABeCB2.0.
HEK293 cells were transfected with eCB2.0 DNA plasmid and changes in fluorescent signal measured by high-throughput fluorescence assay. A-B] Kinetics of GRABeCB2.0 activation (ΔF/F0) induced by increasing concentrations of Δ9-THC (A) or Δ8-THC (B). Shaded areas in time courses and error bars represent s.e.m. Arrows represent inflection points and dotted lines represent initial change in response (slope between t=0 and time at inflection). C] Concentration dependent responses and EC50s of Δ9-THC and Δ8-THC at inducing GRABeCB2.0 fluorescent signal as determined by averaging ΔF/F0 between 4–5 min. d] Δ9-THC (10 μM) and Δ8-THC (10 μM)-stimulated increases in GRABeCB2.0 fluorescent signal are reduced by SR1 (300 nM) and absent in HEK293 cells expressing mut-GRABeCB2.0. E-F] CBD (100 pM-10 μM) does not modulate GRABeCB2.0 fluorescent signal (E) and decreased the 2-AG (1 μM)-stimulated increase in GRABeCB2.0 fluorescent signal (IC50 of 9.7 nM). Statistics: (D) ***P<0.001 significantly different from corresponding CTR treatment (Two-way ANOVA followed by Dunnett’s). n= 3–7 independent experiments performed in triplicate.

