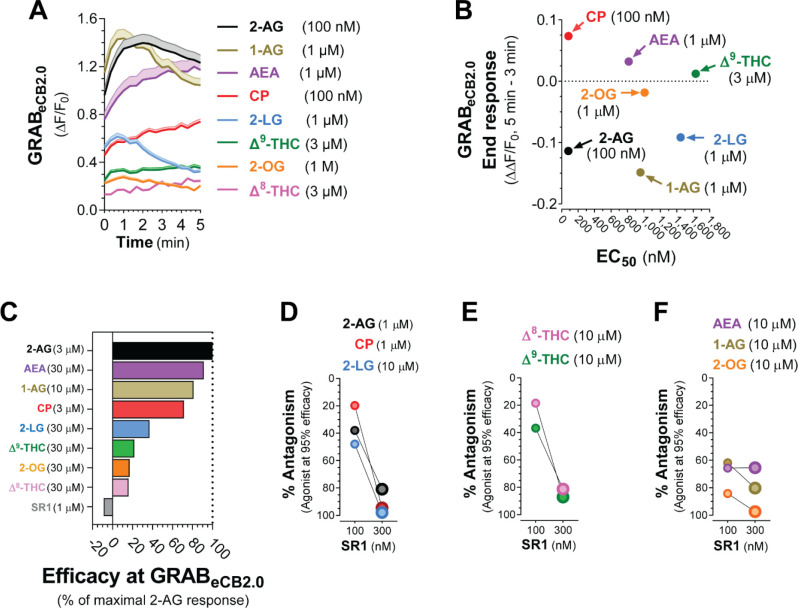
Figure 5: Monoacylglycerols have distinct dynamics and pharmacological properties at GRABeCB2.0 compared to THC, CP, and AEA.
HEK293 cells were transfected with eCB2.0 DNA plasmid and changes in fluorescent signal measured by high-throughput fluorescence assay. A] Comparison of GRABeCB2.0 activation kinetics elicited by each ligand at a concentration that approaches their respective EC50s. Shaded areas in time courses and error bars represent s.e.m. B] Comparison of the EC50 of each ligand and their corresponding end response at a concentration that approached their respective EC50 and measured between 3–5 min. Y axis positive value represent increase in fluorescent signal (i.e., AEA, CP and D9-THC) and negative values represent decrease in fluorescent signal (i.e., 2-AG, 1-AG, 2-LG and 2-OG). C] Comparison of the maximum increase in GRABeCB2.0 fluorescent signal as expressed by area under the curve and as a percent of 3 μM 2-AG produced by each ligand. D-F] Antagonism of each response by SR1 (100 and 300 nM).

