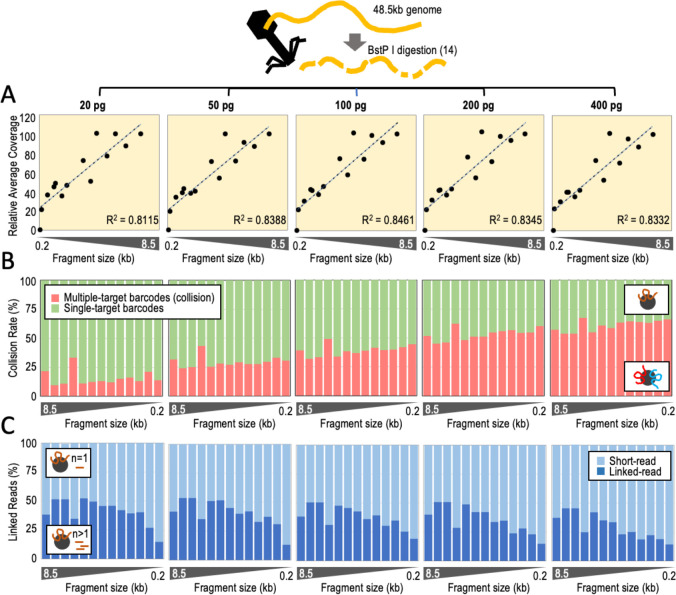
Figure 3. Determining DNA collision rates and linked-read efficiencies using BstP l-digested lambda phage genomic DNA.
A. Relative coverage (average across every fragment) relative to fragment size. On top indicated input amounts of digested fragments. Y-axis represents the average coverage relative to the average coverage with the 8.5 kb fragment, X-axis represents fragment size (each datapoint is one fragment). B. DNA collision rates (%) relative to fragment size by input amounts. C. Percentage of linked reads relative to the total number of short reads by fragment size and input amounts. Analysis limited to microbeads with only one associated fragment (single-barcode fragments or collision-free cases).

