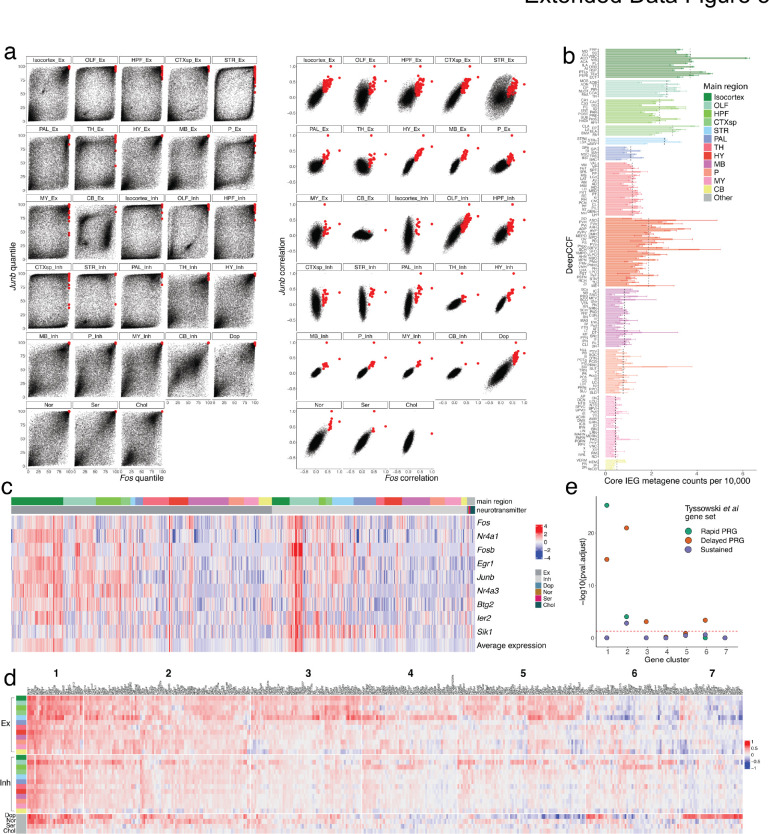
Extended Data Figure 5.
Additional analyses related to activity-related genes. a, Comparison of correlations (right) and quantile of correlation (left) between each gene and both Fos (x-axis) and Junb. Red dots indicate the genes that were selected as candidate ARGs. b, Barplots showing the average counts per 10,000 of the core IEG metagenes (Methods) listed in c. Error bars indicate standard error of average counts per deep CCF region and dashed black lines indicate average counts per main brain region. c, Scaled mean expression of the core IEG metagenes, within each main region, separated by neurotransmitter group. d, Extended heat map showing the correlation with Fos of all candidate ARGs within the seven clustered groups. e, Enrichment analysis (Methods) of each candidate ARG cluster with three established ARG gene sets40. Dotted red line indicates an adjusted p-value threshold of 0.05.

