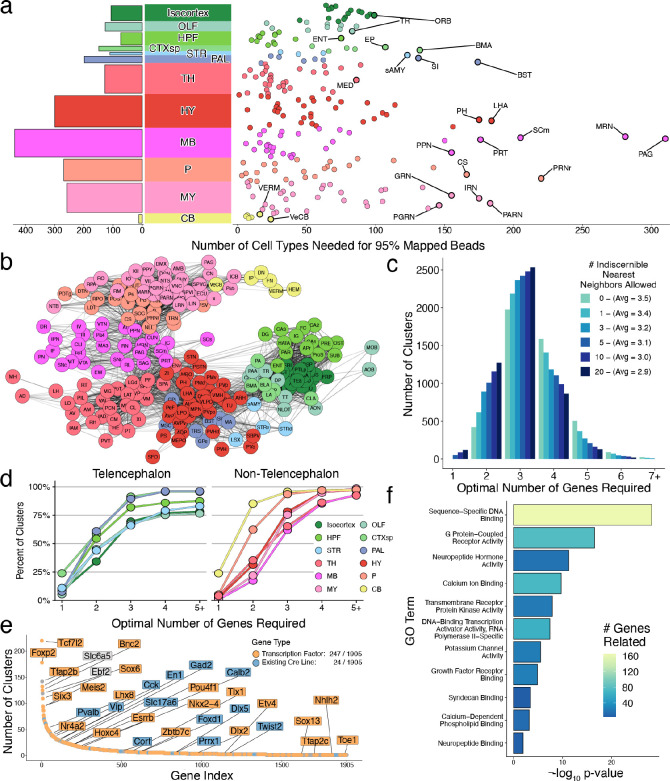
Figure 2.
Cell type diversity across regions of the mouse brain. a, Cumulative number of cell types needed to reach 95% of mapped beads in each DeepCCF region (right) and summarized across individual main regions (left). The DeepCCF regions with the largest values are labeled. b, Force-directed graph showing cell type sharing relationships amongst DeepCCF regions. Edges are weighted by the Jaccard overlap between each region (Methods). c, Histogram of the minimum number of genes required to uniquely define each cell type across the nervous system. The algorithm was repeated, tolerating genes to be the same amongst different numbers of nearest cluster neighbors. d, Cumulative distribution plot of minimum number of genes required to distinguish each cell type within each major brain region, grouped by telencephalic regions (left), and non-telencephalic regions (right). e, Optimally-small collated gene set needed to cover a minimal gene list from each cell type, ranked by how many cell types each gene reaches, colored by transcription factor identity (orange) or if it is a currently available Cre line (blue). f, Barplot quantifying the significantly enriched GO terms in the minimum-sized collated gene list after hierarchical reduction (Methods), colored by the absolute number of genes related.

