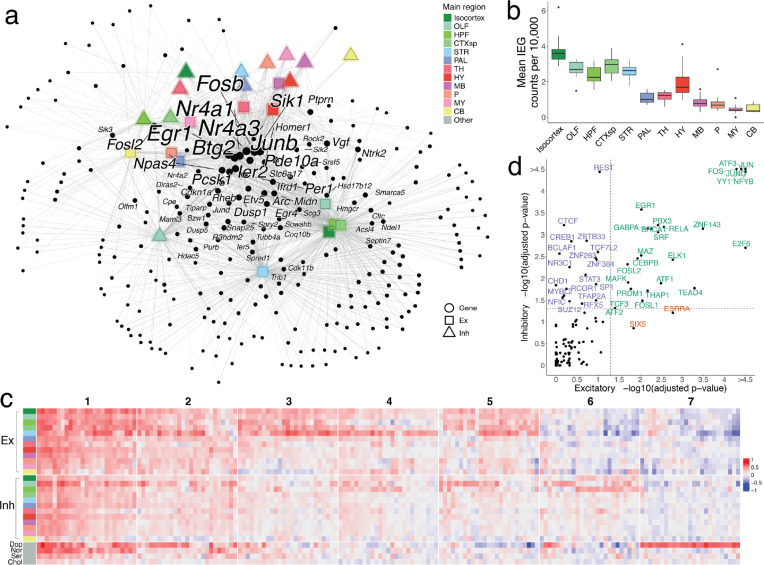
Figure 4.
Patterns of activity-dependent gene expression across brain regions. a, Force-directed graph of a weighted bipartite network. Nodes comprise two disjoint sets: candidate ARGs (black dots) and sets of neuronal cell types of the same neurotransmitter type, localized to the same brain region (shapes colored by region). Edges are weighted based on the correlation coefficient between a gene node and a region node, and edges with weight < 1.3 are pruned. After pruning, nodes with a degree < 2 are also removed. The sizes of nodes and node labels correlate with the degree of the node, where nodes are labeled only if they share edges of weight ≥ 1.3 with at least six regions. b, Box plots quantifying mean core IEG Slide-seq counts per 10,000, colored by main brain regions. c, Downsampled heatmap of correlation coefficients between Fos and candidate ARGs (columns) across major regions of the brain (rows). Numbers at the top correspond to ARG cluster identities. d, Scatter plot quantifying transcription factor enrichment (p-value < 0.05, FDR-corrected) between excitatory and inhibitory populations. TFs are colored by their cell type enrichment specificity.

