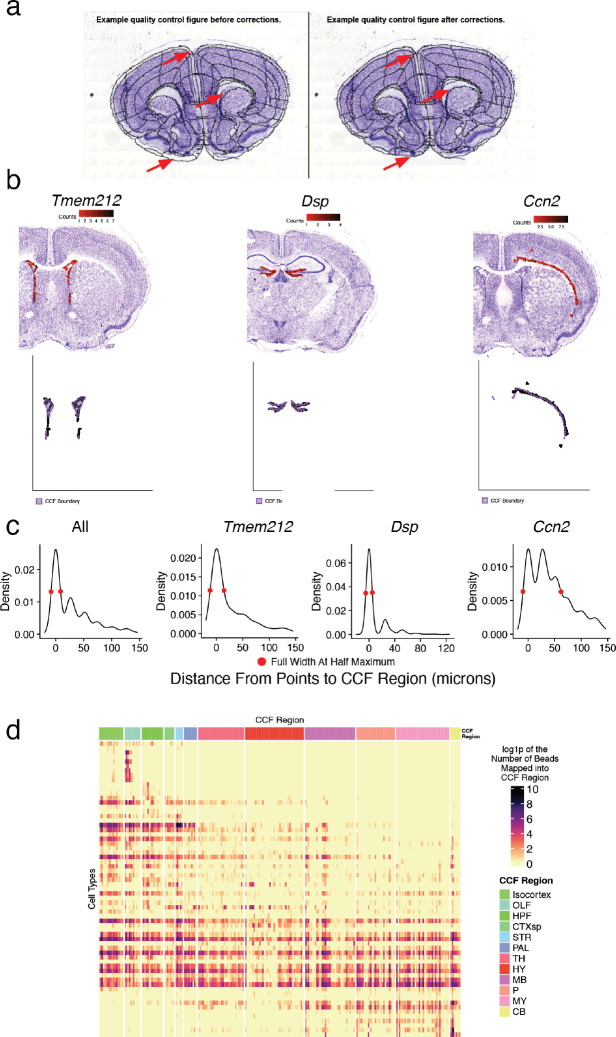
Extended Data Figure 2.
Quality control and summary statistics of CCF integration and cell type mapping. a, Example images of adjacent Nissl sections aligned to CCF with 2D rigid transformation (wireframe outline) before (left) and after (right) correcting alignment with a 2D diffeomorphism. Red arrows point to example regions with incorrect alignment, and improvement after application of the correction. b, Expression of three highly specific marker genes that label the ventricular lining (Tmem212), dentate gyrus granule layer (Dsp), and layer 6b of isocortex (Ccn2) in Slide-seq (top row). Bottom row shows the positions of individual beads with expression with respect to the boundaries of the expected CCF region (purple). c, Density plot of the distance of each bead expressing each of the three marker genes (or all combined) shown in b across the corresponding Slide-seq sections. The full width half maximum of the density profile is shown. d, Heat map representing the frequency of bead mappings for each glial cell type, across DeepCCF regions.

