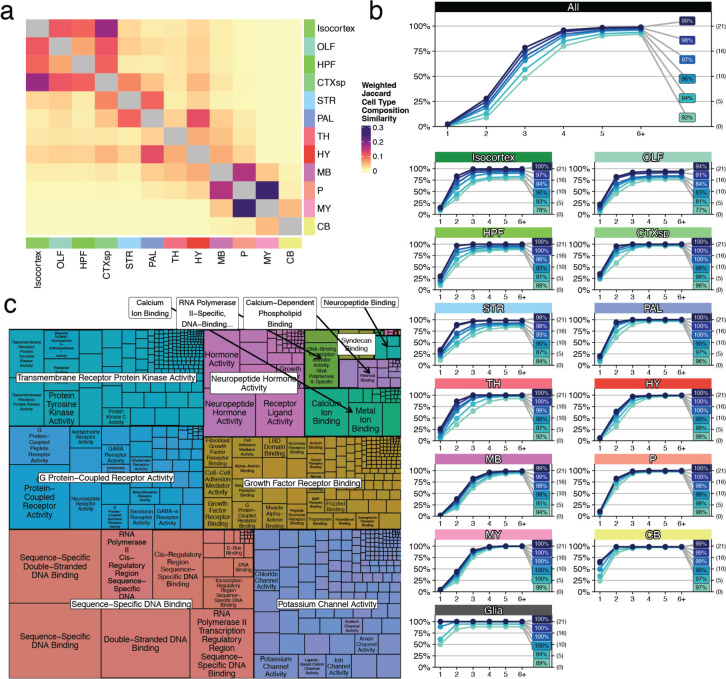
Extended Data Figure 3.
Extended analyses quantifying neuronal cell type diversity across brain areas. a, Heatmap representing the weighted Jaccard similarity in cell type composition between each of the 12 main brain areas (Methods). b, Cumulative distribution plots of the number of genes needed to label each cell type, within each of the 12 major brain areas. Within each region, each of the sets of individually colored plots denotes an algorithmic run with a different number of nearest neighbors that are tolerated as having the same gene markers (absolute number in parentheses at right). The colored percentages denote the proportion of cell types for which the algorithm was able to find a solution. c, Treemap visualization of the GO hierarchy enriched in the minimum-sized collated gene list after hierarchical reduction (Methods).

