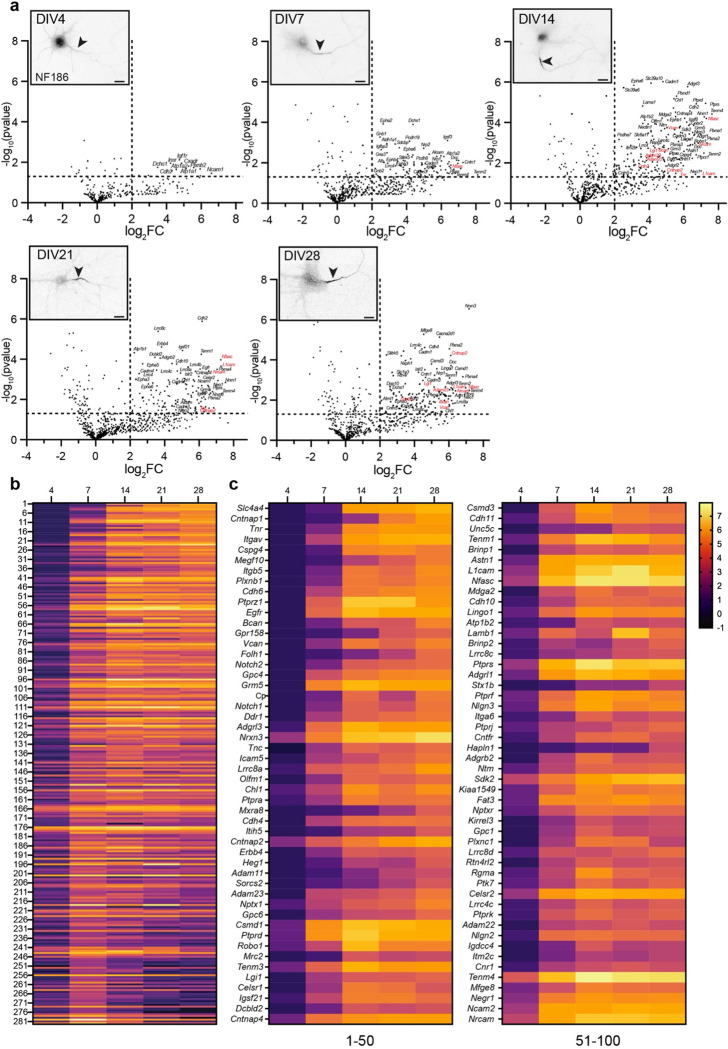
Figure 2. NF186 proximity proteomes across neuronal development.
a, Volcano plots showing the log2-fold changes of proteins versus the statistical significance −log10(pvalue) identified using Nfasc-directed proximity biotinylation (N=3). p<0.05 was used as a cutoff for significance (horizontal dashed line). Some identified proteins are indicated (corresponding gene names listed), with those previously reported as AIS cell surface proteins in red, respectively. Inset images show immunofluorescence labeling of NF186 at different timepoints of hippocampal neuron development in vitro. Lower panels: magnified images show the Nfasc-labeled AIS at each time point. Scale bars, 20 μm. b, Heatmaps showing log2-fold changes at each timepoint for all 285 proteins that satisfied two filtering criteria [(1) normalized PSMs > 10; (2) log2FC (Nfasc/Ctrl) > 2] for at least one of five timepoints, rank-ordered by the slope of the linear regression of their log2 fold enrichment over time. c, Expanded heat map showing gene names for the proteins (1–50 and 51–100) with the largest rate of increase in PSM count (B). Data shown are from N = 3 replicates for each timepoint (see Figure S2).

