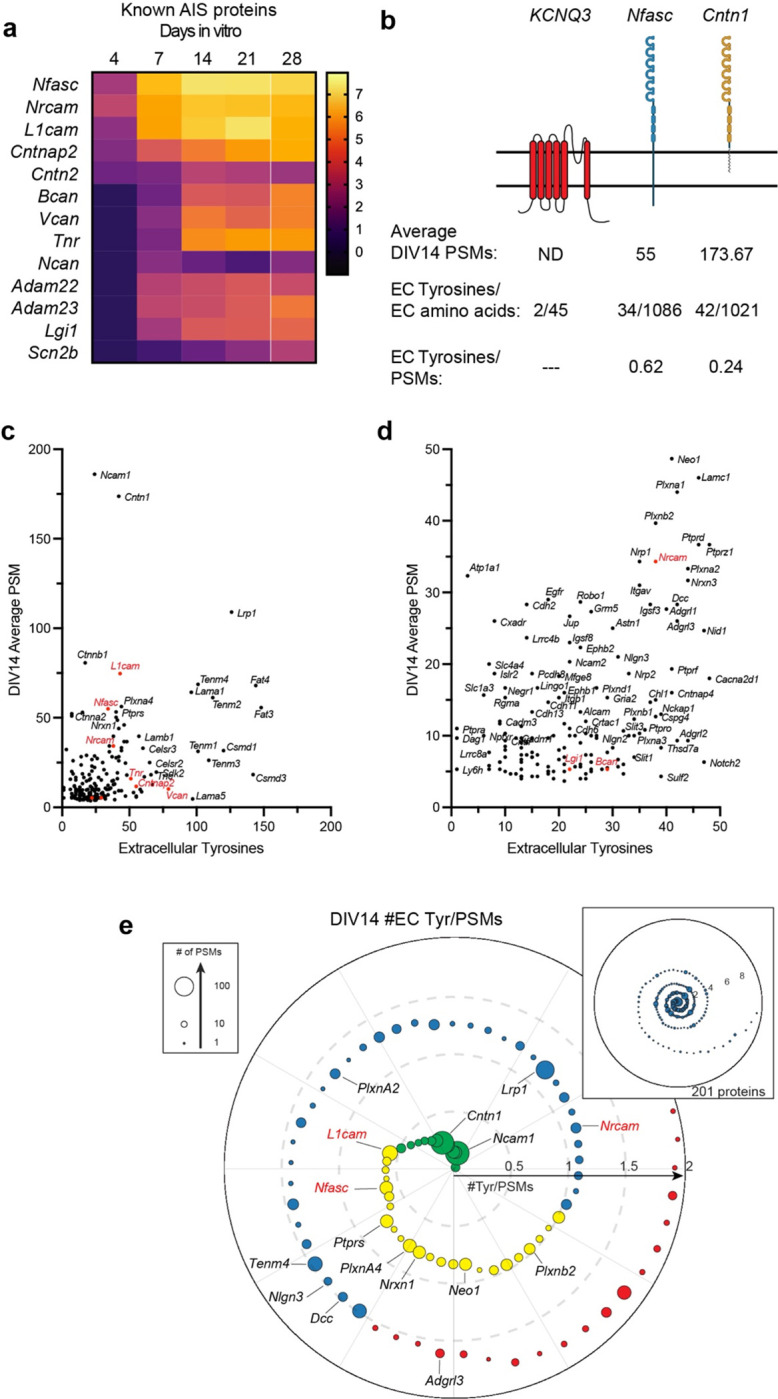
Figure 3. Nfasc-BAR identifies known AIS membrane and membrane-associated proteins.

a, Known AIS membrane and membrane associated proteins and their log2FC (Nfasc/Ctrl). b, Illustration of membrane topology, average PSMs (at DIV14), and the number of extracellular tyrosine residues for three different AIS and membrane proteins. Figure generated using Biorender. c, d, Scatter plot of the number of peptide spectral matches (PSMs) for each biotinylated protein identified by mass spectrometry as compared to the number of tyrosine residues present in each protein’s extracellular domain, shown at different scales. Proteins in red were previously reported at the AIS. e, Proximity plot showing biotinylated proteins (at DIV14) ordered by extracellular (EC) tyrosine/PSM ratio. The plot is an estimate of abundance and proximity to the HRP secondary antibody bound to the Nfasc primary antibody. Each protein is represented by a circle with size proportional to the number of PSMs identified for that protein. Proteins analzyed in subsequent experiments are indicated by their gene names. EC Tyrosine/PSM ratio: 0–0.5 green, 0.5–1.0 yellow, 1.0–1.5 blue, 1.5–2.0 red.
