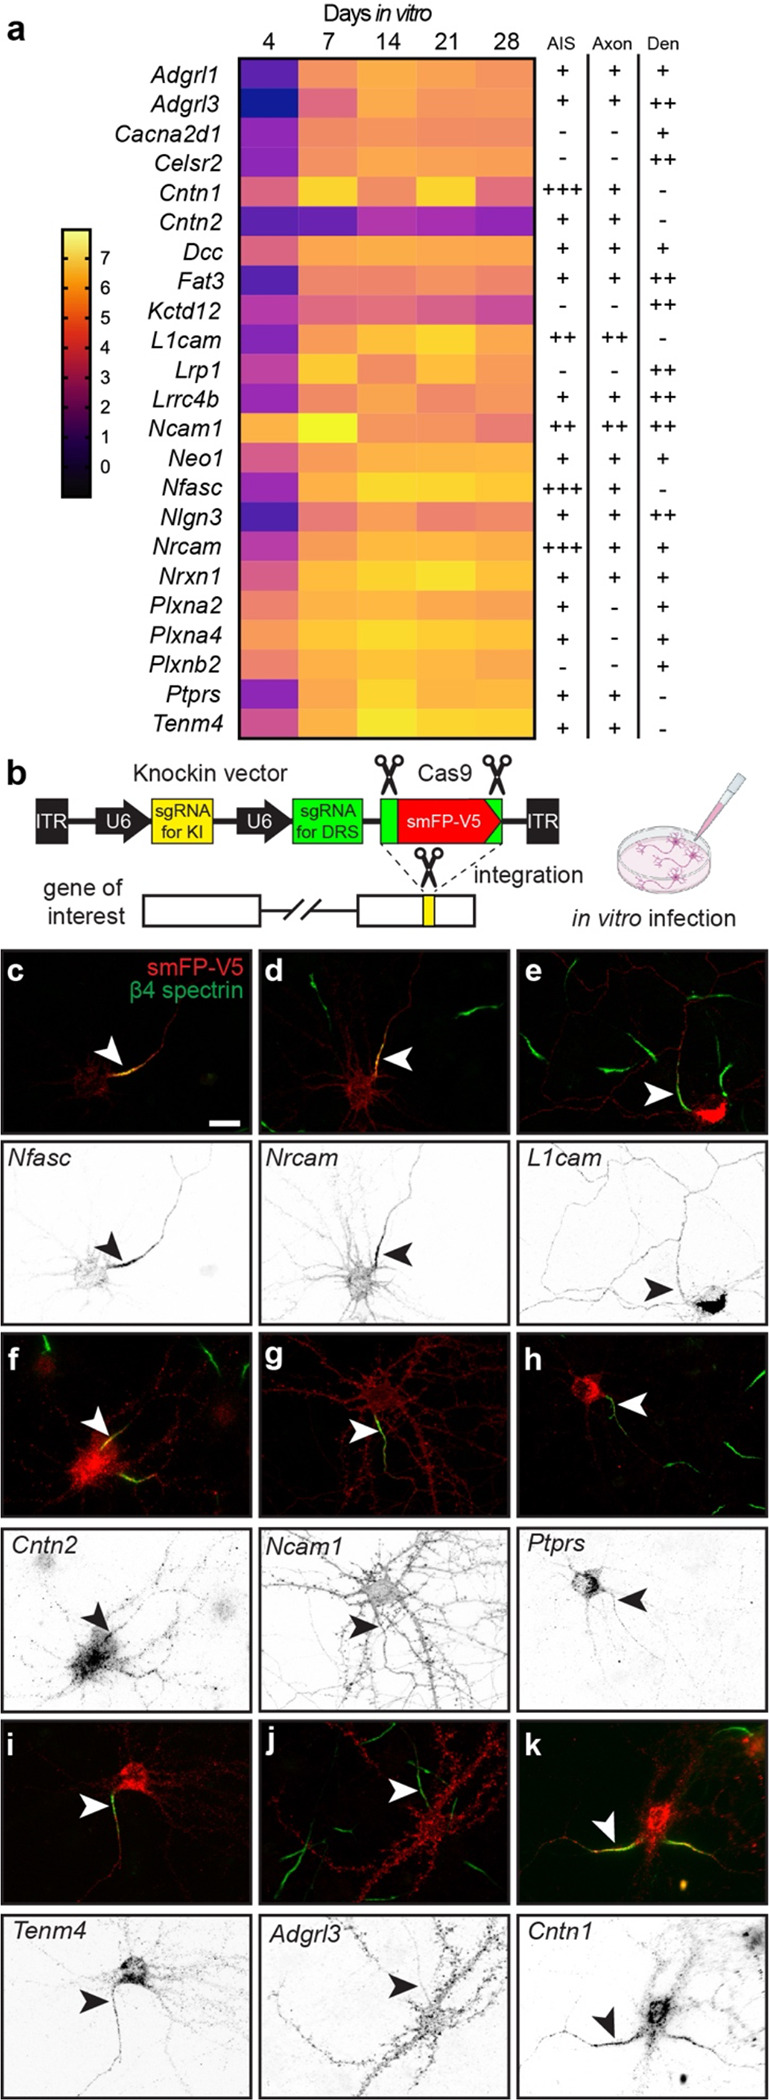
Figure 4. Tagging of endogenous membrane proteins.

a, Proteins whose distribution was tested using endogenous protein tagging. The heatmap shows the increase in expression level is shown as a function of days in vitro (see also Figure 2c). The presence of the tagged protein in AIS, axon, and dendrite is indicated. b, Schematic of the knock-in vector for in vitro CRISPR-mediated endogenous gene tagging. DRS, donor recognition sites. c-k, Examples of smFP-V5 tagged proteins (red) enriched at the AIS (c, d, f, k), the axon (e, g), dendrites (j), or in multiple domains (e, g, h, i). AIS are labeled for β4 spectrin (green) and are indicated by an arrowhead. Scale bar, 20 μm.
