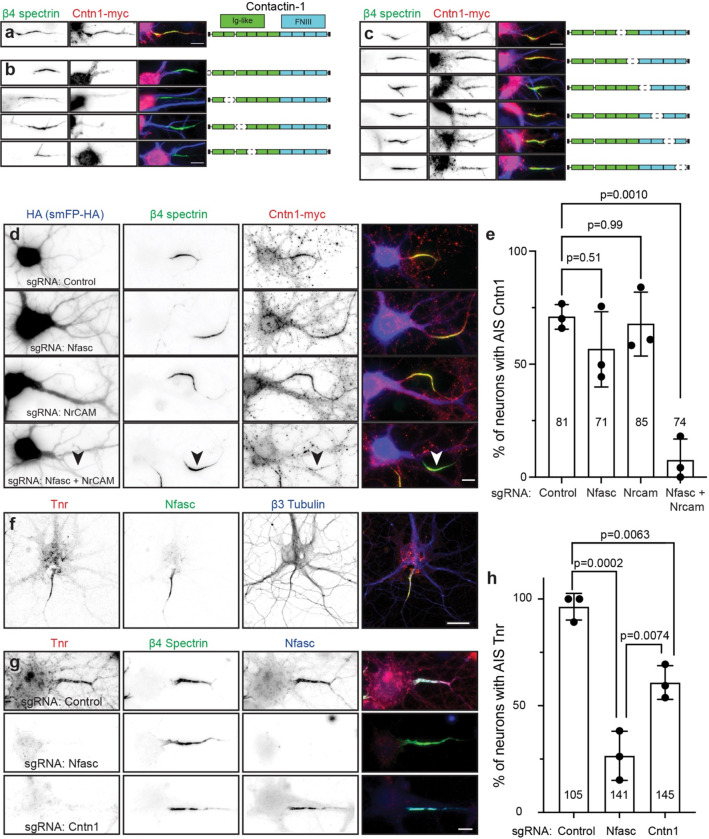
Figure 6. Cntn1 is recruited to the AIS through interactions with AnkG-binding L1-family cell adhesion molecules.
a,Cntn1-myc (red) is targeted to the AIS and colocalizes with β4 spectrin (green). Cntn1 consists of 6 N-terminal Immunoglobulin (Ig)-like domains and 4 C-terminal Fibronectin type III (FNIII) domains. Scale bar, 10 μm. b, Cntn1-myc with N-terminal and internal deletions of the first 4 Ig-like domains fail to localize at the AIS. Scale bar, 10 μm. c, Cntn1-myc localization to the AIS does not depend on the last 2 Ig-like domains or any FNIII domain. Scale bar, 10 μm. d, Cultured hippocampal neurons transduced with AAV to express Cas9 and control, Nfasc, NrCAM, or Nfasc+NrCAM gRNAs. Neurons were labeled using antibodies against HA as a transduction marker (to label the spaghetti monster fluorescent protein tagged with HA, smFP-HA; blue), β4 spectrin (green), and Cntn1-myc (red). Scale bar, 10 μm. e, Quantification of the percentage of transduced neurons with AIS Cntn1-myc. N= 3 independent experiments. Ordinary one-way ANOVA with Tukey’s multiple comparisons test. Error bars, ±SEM. The total number of neurons analyzed is also indicated. f, Immunostaining of cultured hippocampal neurons using antibodies against Tenascin R (Tnr; red), β4 spectrin (green), and β3 Tubulin (blue). Scale bar, 25 μm. g, Cultured hippocampal neurons transduced with AAV to express Cas9 and control, Nfasc, or Cntn1 gRNAs. Neurons were labeled using antibodies against Tnr (red), β4 spectrin (green), and Nfasc (blue). Scale bar, 10 μm. h, Quantification of the percentage of transduced neurons with AIS Tnr. N= 3 independent experiments. Ordinary one-way ANOVA with Tukey’s multiple comparisons test. Error bars, ±SEM. The total number of neurons analyzed is also indicated.

