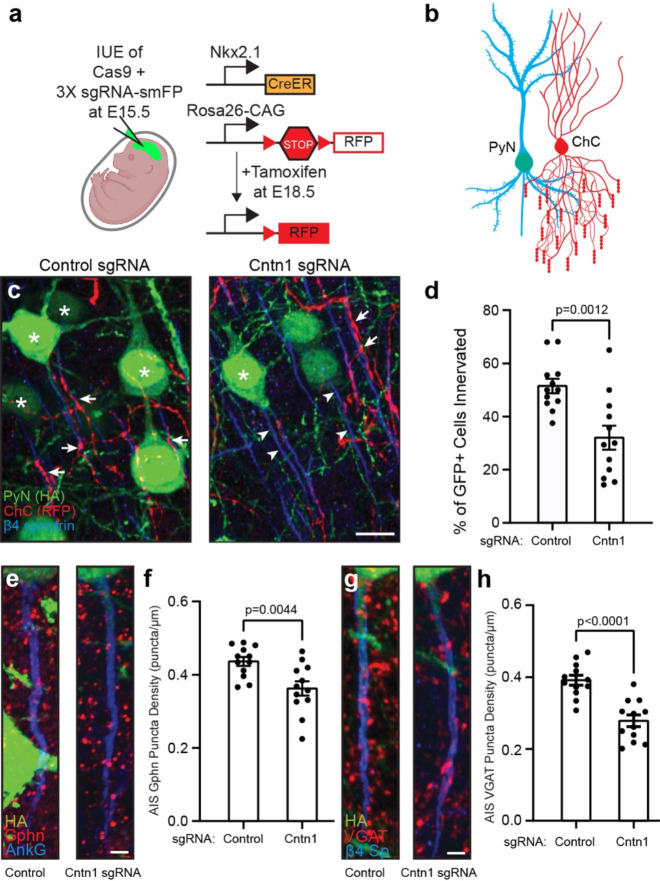
Figure 8. Pyramidal neuron Cntn1 is important for AIS synaptic innervation by ChCs.
a, Illustration of the knockout and labeling strategy for PyN and ChCs. PyNs are electroporated at E15.5 using plasmids to express Cas9 and 3X sgRNA-smFP (HA tag) to delete expression on Cntn1. ChCs are labeled by expression of red fluorescent protein (RFP) using inducible Cre (CreER) in Nkx2.1-CreER mice at E18.5. b, Illustration of ChC (red) innervation of PyN (blue/green) AIS. c, Representative images of PyNs innervated at their AIS by ChC cartridges (red) in layer II of the Ogawa, Lim et al. somatosensory cortex from Nkx2.1-CreER;Ai9 mice co-electroporated at E15.5 with a plasmid expressing Cas9 and a plasmid expressing smFP-HA and a control sgRNA or Cntn1 sgRNA; mice were sacrificed at P17. AISs and PyNs are visualized by immunostaining for β4 spectrin (blue) and HA (green), respectively. Stars in C indicate HA+ PyNs and arrows indicate ChC innervation of PyN AISs. Arrowheads in C indicate AIS of transfected with Cntn1 sgRNA and that lack innervation by ChC cartridges. Scale bar, 10 μm. d, Quantification of the percentage of HA+ PyNs innervated by single RFP+ ChCs at P17. 12 ChCs and 15–66 HA+ PyNs per ChC from 3 animals were analyzed for each condition. Data are mean ± SEM. e, f, Representative images of HA+ PyN AISs from Nkx2.1-CreER;Ai9 mice electroporated at E15.5 with plasmids indicated in (a) and sacrificed at P17. Inhibitory synapses are visualized by immunostaining for the GABAergic postsynaptic marker gephyrin (Gphn; red; e) or the GABAergic presynaptic marker VGAT (red; g). AISs (blue) are visualized by immunostaining for AnkG in e and β4 spectrin in g. Scale bars, 2 μm. f, h, Quantification of the average number of gephyrin (f) or VGAT (h) puncta per μm of HA+ PyN AIS at P17. 23–40 AISs from 4 fields of view from 3 animals were analyzed for each condition. Data are mean ± SEM.

