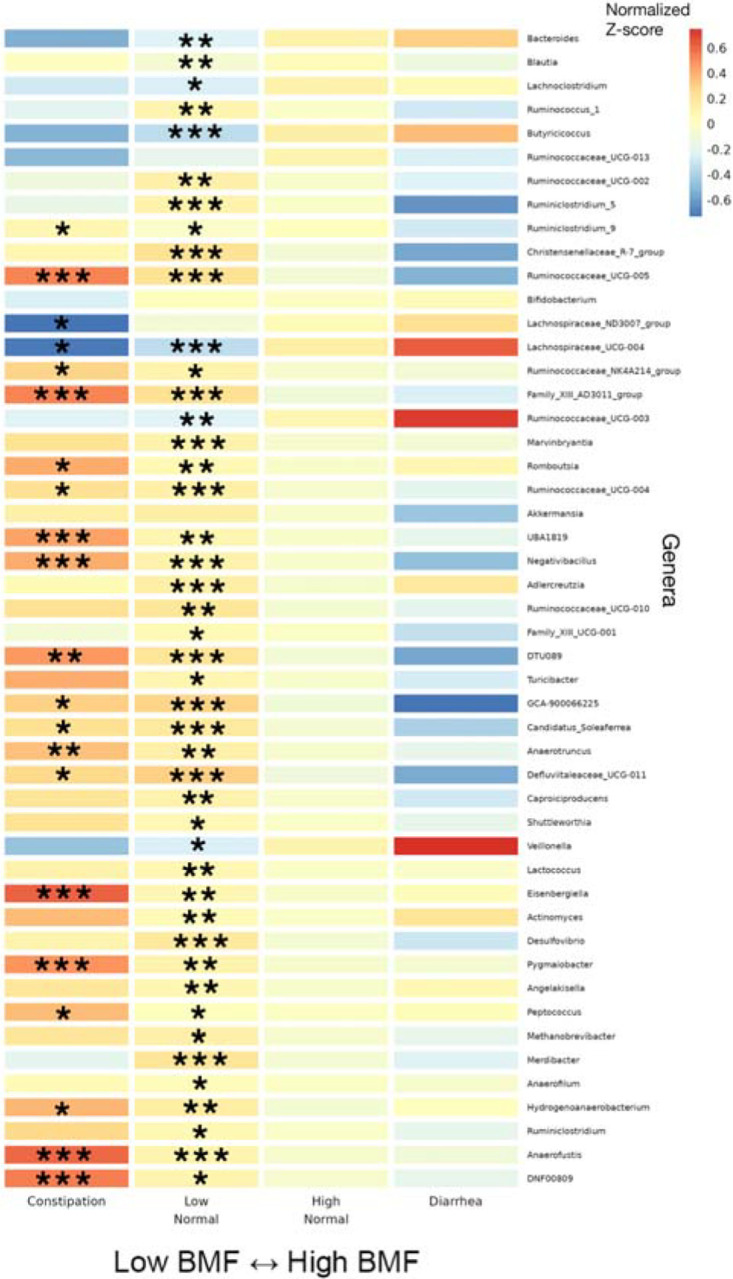
Figure 4. Heatmap of average z-scored CLR abundances within each BMF category for all annotated genera significantly associated with BMF.

46 significant taxa, in order of decreasing average relative abundance, with their z-scored, CLR-transformed abundances averaged within each BMF category plotted as a heatmap. Covariates included sex, age, BMI, eGFR, LDL, CRP, A1C, and PCs1–3. Asterisks denote the individual FDR-corrected significance threshold for the Wald Test p-value of the βBMF-coefficient for each BMF category, relative to the high-normal reference category. Rows without asterisks showed a significant overall model (FDR p-value <0.05), despite a lack of significance for the individual coefficients. (***): p < 0.0001, (**): 0.0001 < p < 0.01, (*): 0.01 < p < 0.05.
