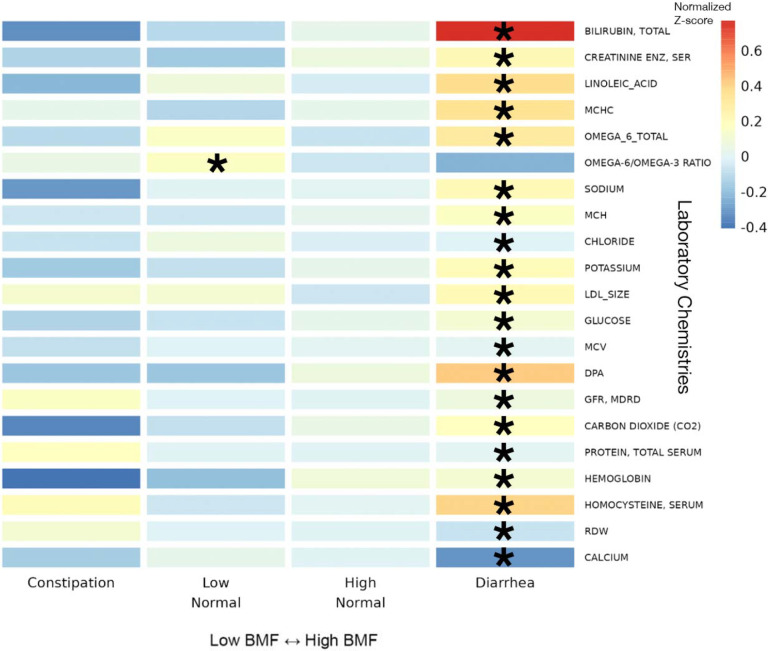
Figure 6. Heatmap of average z-scored clinical chemistries within each BMF category for all chemistries significantly associated with BMF.
22 BMF-associated chemistries, identified using LIMMA models with FDR-corrected p-values of the ratio test between the main model and the null model, with average z-scores within each BMF category plotted as a heatmap. Here, the covariates included sex, age, BMI, eGFR, LDL, CRP, A1C, and PCs1–3. Asterisks denote FDR-corrected p-value thresholds for metabolites with significant βBMF coefficient(s) in the linear regression model. (***): p < 0.0001, (**): 0.0001 < p < 0.01, (*): 0.01 < p < 0.05.

