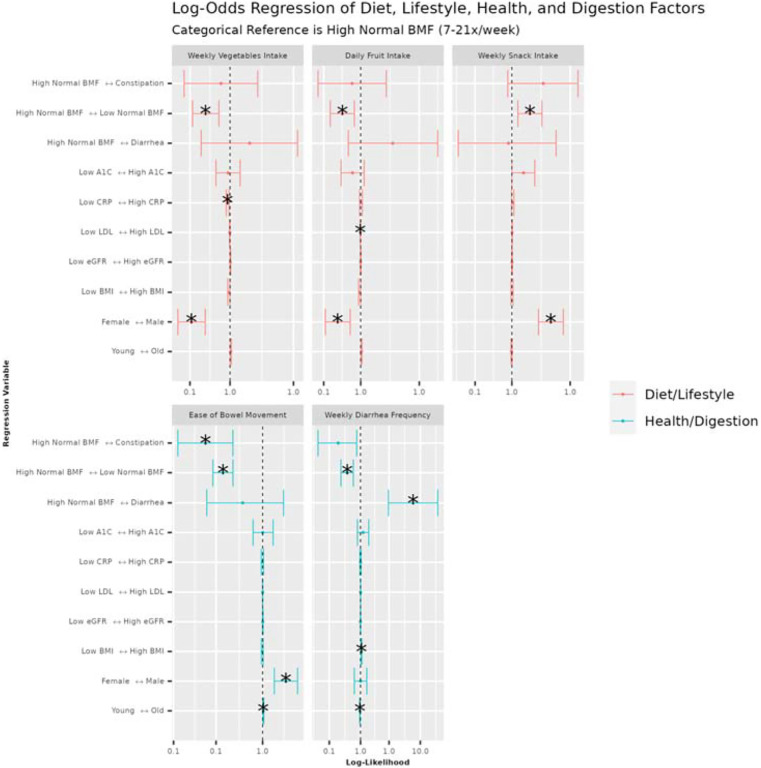
Figure 7. Ordinal regression odds ratio for health, diet, and lifestyle survey data vs BMF and covariates.
Variables are colored by category: questions related to diet, exercise, and lifestyle (Diet/Lifestyle), and questions related to current digestive symptoms/function and health history (Health/Digestion). The BMF reference category was “high-normal” BMF (7–21 bowel movements per week). Each tick on the vertical axes represents a directional association in likelihood across the horizontal axis. The center line over the plots at x = 1.0 represents an equal likelihood of reporting an increase in number, intensity, frequency, or agreement (depending on the response variable) between the left side of the arrow on the vertical axis tick and the right side of the arrow on the vertical axis tick. A confidence interval that does not span the center line is significantly associated with the independent variable on the vertical axis tick. (*): FDR-corrected p-value < 0.05.

