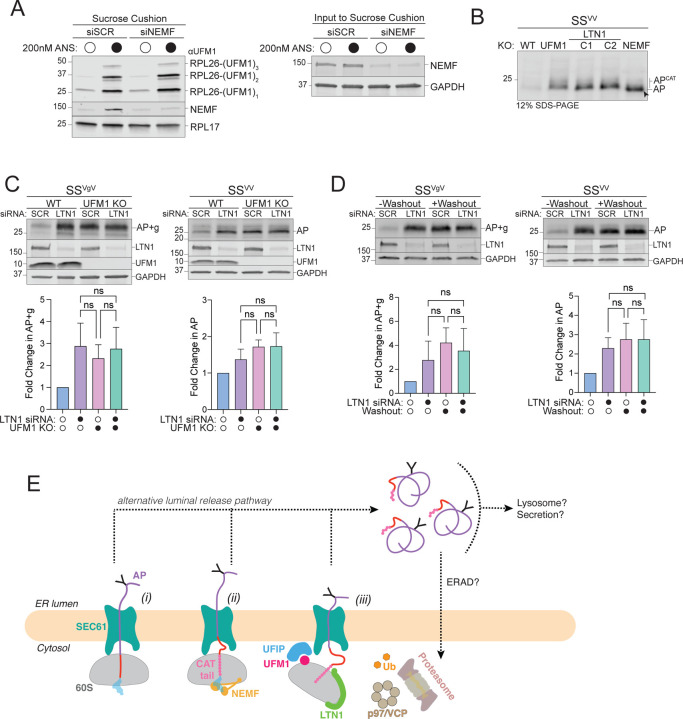
Figure 5: RQC machinery cooperates with UFMylation to degrade ER-APs.
A: NEMF is not required for RPL26 UFMylation. Left panel, Sucrose cushion sedimentation of WCLs derived from HEK293 cells transfected with either scrambled (SCR) or NEMF siRNA and treated with either DMSO or 200 nM ANS for 30 min to induce RPL26 UFMylation. Pellets were immunoblotted with anti-UFM1 and anti-NEMF antibodies. RPL17: loading control. Right panel, Effect of scrambled (SCR) or NEMF siRNA on endogenous protein levels, assayed by immunoblot for endogenous NEMF with anti-NEMF antibody in WCLs (input to sucrose cushion). GAPDH: loading control.
B: ER-AP CATylation is independent of UFMylation. HEK293 WT, NEMFKO, LTN1KO (two independent clonal lines, C1 and C2), and UFM1KO cells were transfected with SSVV. WCLs were separated on 12% SDS-PAGE and analyzed by immunoblot with anti-FLAG antibody. Unmodified AP are indicated by the label “AP” and by arrowheads; CATylated AP are indicated by “APCAT”; data shown are representative of two independent experiments.
C: UFM1 and LTN1 act in the same pathway to degrade ER-APs. Upper panels, WT or UFM1KO HEK293 cells were transfected with either scrambled (SCR) or LTN1 siRNA and the indicated reporters. Reporter products were analyzed by immunoblot with FLAG antibody. Knockout or knockdown was confirmed by immunoblot for endogenous LTN1 or UFM1 proteins with anti-LTN1 or anti-UFM1 antibodies, respectively. GAPDH: loading control. Lower panels, Quantification of AP intensity for SSVV and AP+g intensity for SSVgV. Fold change relative to WT cells was calculated after normalization to GAPDH. Data are the mean ± SD of at least 2 independent experiments. ns > 0.05, determined by one-way ANOVA.
D: UBA5 and LTN1 act in the same pathway to degrade ER-APs. Upper panels, U2OS UBA5DD cells were transfected with either scrambled (SCR) or LTN1 siRNA and the indicated reporters. Cells were cultured in complete DMEM with TMP (“-Washout”) or washed to remove TMP from the media (“+Washout”). Reporter products were analyzed by immunoblot with FLAG antibody. Knockdown was confirmed by immunoblot for the endogenous LTN1 protein with anti-LTN1 antibody. GAPDH: loading control. Lower panels, Quantification as in Fig 5C. Fold change for (“+Washout”) relative to control (“-Washout”) was calculated after normalization to GAPDH. Data are the mean ± SD of at least two independent experiments. ns > 0.05, determined by one-way ANOVA.
E: Model of ER-AP degradation. ER-APs partition between facilitated backsliding through SEC61 to cytosol (steps i-iii) or release into the ER lumen (dashed lines). Once released into the ER lumen, ER-APs are stable but could be subject to trafficking or other degradation pathways. UFIP: UFM1 interacting protein. See text for details.

