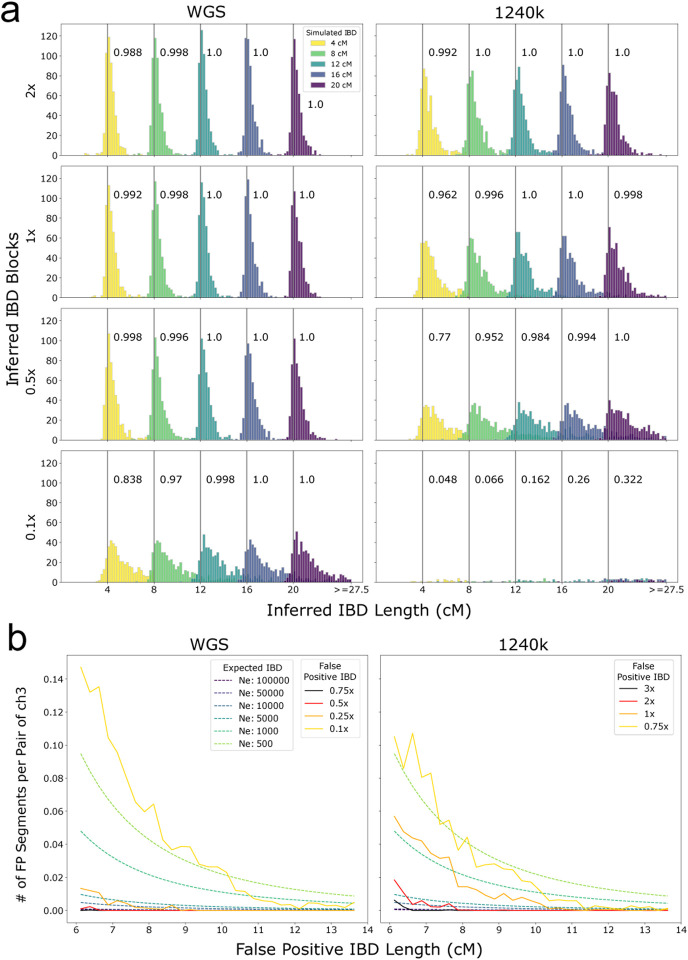
Figure 2: Performance of ancIBD on simulated IBD segments.
a: Power and segment length errors. We copied in IBD segments of lengths 4,8,12,16,20 cM into synthetic diploid samples. We simulated shotgun-like and 1240k-like data (as described in Supp. Note S2) and visualize false positive, power, and length bias for 1x, 0.5x, and 0.25x coverage (rows). For each parameter set and IBD length, we simulated 500 replicates of pairs of chromosome 3, each pair with one copied-in IBD segment. The power (or recall) of detecting IBD segments of each simulated length is indicated in the text next to the corresponding gray vertical bar. b: False positive rate. We downsampled high-quality empirical aDNA data without IBD segments (Supp. Tab. 1F) to establish false positive rates of IBD segments for various coverage and IBD lengths (described in Supp. Note S5). We visualized expected IBD sharing assuming various constant population sizes to contextualize the false positive rates.

