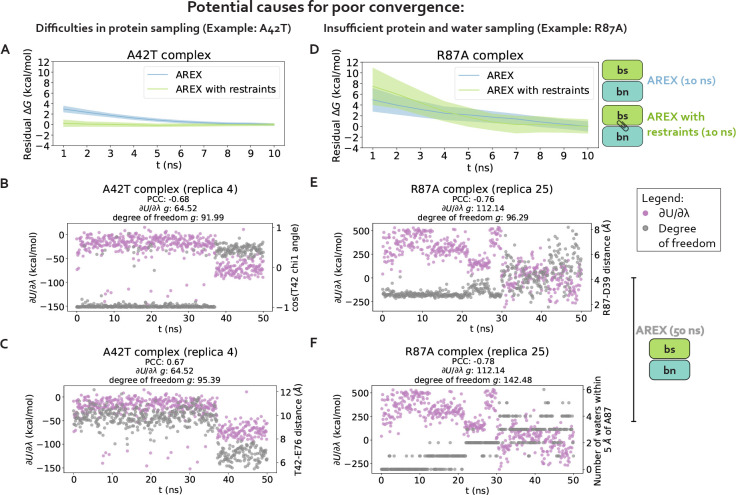
Figure 4. Complex phase convergence problems can arise due to insufficient sampling of protein and water degrees of freedom, e.g., a sidechain rotamer and intra-barstar contact for A42T and an interface contact and neighboring waters for R87A.
(A) Residual complex phase free energy difference (ΔG) time series for AREX simulations of A42T (number of states = 24 and simulation time = 10 ns/replica), where the residual ΔG is computed as ΔG(t) − ΔG(t = 10ns). Blue curve represents the time series for the AREX simulation without restraints and green curve represents the time series for the AREX simulation with heavy atoms restraints (force constant = 50 kcal/molÅ2). Shaded regions represent ± two standard errors, which were computed by bootstrapping the decorrelated reduced potential matrices 200 times. (B) Time series for ∂U/∂λ (left y-axis, purple) and χ1 angle for residue T42 (right y-axis, gray) for a representative replica (replica 4) of the A42T complex phase AREX simulation (number of states = 24, simulation time = 50 ns/replica). PCC indicates Pearson correlation coefficient and g indicates statistical inefficiency. (C) Time series for ∂U/∂λ (left y-axis, purple) and T42-E76 distance (right y-axis, gray) for a representative replica (replica 4) of the A42T complex phase AREX simulation (number of states = 24, simulation time = 50 ns/replica). (D) Same as (A), but for R87A instead of A42T (number of states = 36 and simulation time = 10 ns/replica). (E) Time series for ∂U/∂λ (left y-axis, purple) and R87-D39 distance (right y-axis, gray) for a representative replica (replica 25) of the R87A complex phase AREX simulation (number of states = 36, simulation time = 50 ns/replica). (F) Time series for ∂U/∂λ (left y-axis, purple) and number of waters within 5 Å of A87 (right y-axis, gray) for a representative replica (replica 25) of the R87A complex phase AREX simulation (number of states = 36, simulation time = 50 ns/replica).

