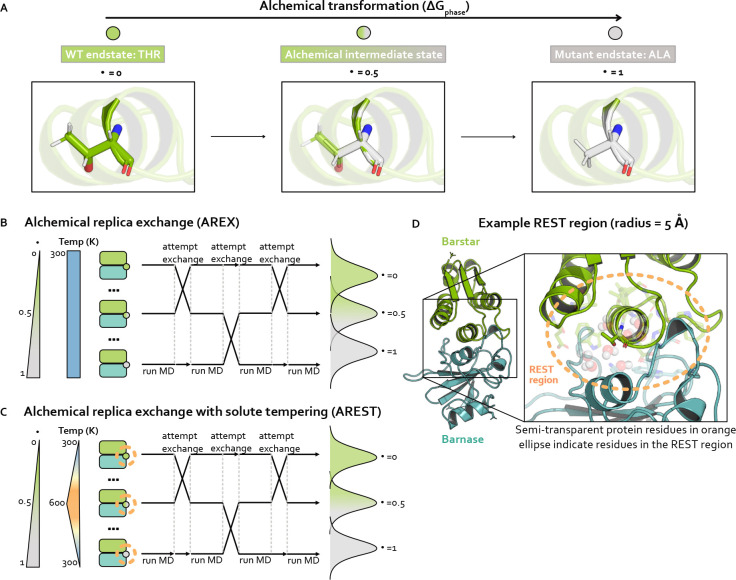
Figure 2. Strategies for sampling an alchemical transformation: Alchemical replica exchange (AREX) and alchemical replica exchange with solute tempering (AREST). AREST modifies AREX by introducing local heating around the alchemical region at intermediate alchemical states.
(A) Schematic representing an alchemical transformation (with one alchemical intermediate state) for one simulation phase. The WT (, green) endstate contains a fully-interacting threonine residue and the mutant (, gray) endstate contains a fully-interacting alanine residue. The alchemical intermediate (, green-gray gradient) state contains partially interacting threonine and alanine residues. Nitrogen atoms are shown in blue and oxygen atoms are shown in red. (B) Schematic representing alchemical replica exchange (AREX), sometimes called Hamiltonian replica exchange among alchemical states, which utilizes multiple replicas (in this schematic, three replicas) to explore alchemical states that bridge the WT (, green circle) and mutant (, gray circle) fully interacting states. The temperature remains constant at 300 K for all alchemical states. Representative configurational distributions for each alchemical state are shown (on the right) to be overlapping for neighboring states, which is a requirement for accurate estimates. (C) Schematic representing alchemical replica exchange with solute tempering (AREST), which elevates the effective temperature for a small region (i.e., the REST region) to further enhance sampling. The REST region is shown as an orange, dashed circle. The effective temperature of the REST region reaches a maximum at 600 K at . Representative configurational distributions for each alchemical state are shown (on the right) with less overlap than in AREX (panel B), because increasing the effective temperature usually causes increased thermodynamic length. (D) Structural model of barnase:barstar with barstar shown in green and barnase shown in blue. Zoomed-in view highlights an example REST region (orange, dashed circle) for residue T42 in barstar. T42 and neighboring residues (within 5 Å of T42) are shown as sticks and neighboring waters (also within 5 Å of T42) are shown as spheres.

