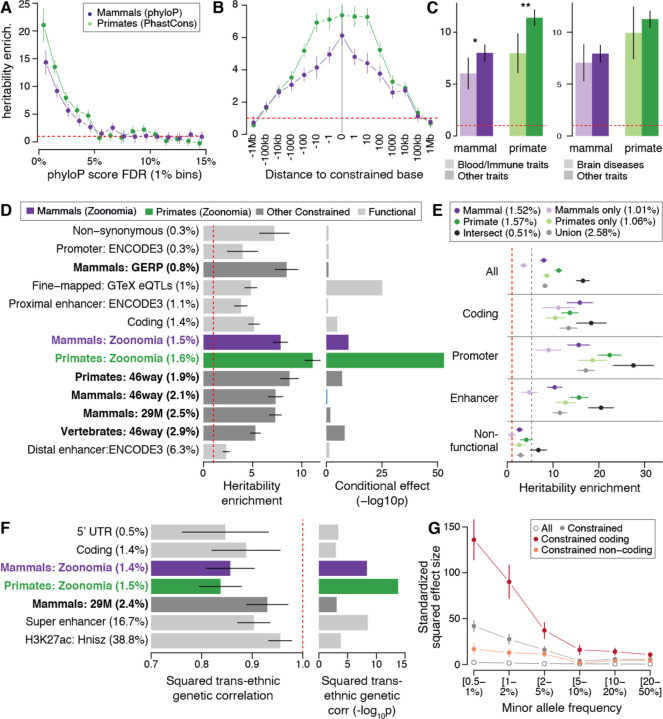
Fig. 2. SNP-heritability analyses of variants at constrained positions in human complex traits and diseases.
(A) Heritability enrichment of common SNPs in the top percentiles of constraint scores in placental mammals (phyloP) and primates (phastCons). (B) Heritability enrichment as a function of the distance to a constrained base. (C) Heritability enrichment of constrained annotations in 11 blood and immune traits and 9 brain diseases (light color) versus other types of traits (dark color). Asterisks indicate significance at P < 0.05 and double Asterisks indicate significance at P < 0.05 after Bonferroni correction (0.05/4). (D) Heritability enrichment of constrained and functional annotations (left), and corresponding significance of the conditional effect while considered in a joint model with 106 annotations (right). (E) Heritability enrichment of constrained annotations intersected together and stratified by their genomic function. The dashed grey line represents heritability enrichment in coding regions (plotted for comparison purposes). (F) Squared trans-ancestry genetic correlation enrichment (left) with corresponding significance (right) for 7 annotations with significant depletion of squared trans-ancestry genetic correlations. (G) Standardized squared effect sizes as a function of allele frequency. Results are meta-analyzed across 63 independent GWAS (A, B, C, E), 31 independent traits with GWAS available in European and Japanese populations (F), and 27 independent UK Biobank traits (G). Dashed red lines represent a null enrichment of 1 (A-E) and a null squared trans-ancestry genetic correlation (f). Error bars are 95% confidence intervals. Numerical results are reported in tables S2, S3, S4, S6, S7, S8, and S11.

