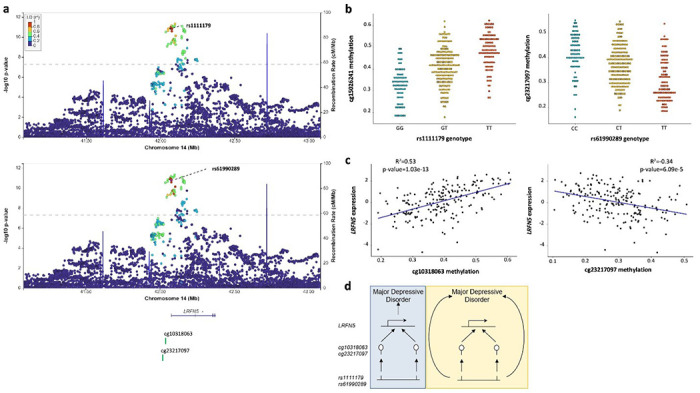
Figure 4. Two different CpGs pleiotropically associated with MDD.

The mQTL-SNPs rs1111179 and rs61990289, highlighted as purple diamonds, with the −log10 p-values of the original MDD GWAS are represented in the a locusZoom plot. The X-axis displays the involved genomic region of chromosome 14 in Mb, showing the distribution of the coding genes in the locus, as well as the location of the cg10318063 and cg23217097 mQTL-CpGs. The Y-axis shows the −log10 p-value from the original GWAS, and the SNPs are colour coded as a function of the LD with the highlighted SNP. The two significant mQTLs, rs1111179-cg10318063 and rs61990289-cg32217097, are plotted in the b dotplots, where Y-axis represents the beta DNAm values of the indicated CpG, ranging from 0 to 1. The X-axes display the genotype of the indicated SNPs. The eQTM of cg10318063 and cg32217097 mQTL-CpGs are portrayed in the c dotplots, where X-axis represents the DNAm values from each involved CpG, ranging from 0 to 1. The Y-axes display the expression values of the LFRN5 gene in placenta. The hypothesis of the pleiotropical association between the SNPs, the DNAm values of the CpGs in placenta, the gene expression levels of LFRN5 in placenta and MDD are schematically represented in d. The vertical pleiotropy (or causal association) hypothesis is represented with a blue backgroud, and the horizontal pleiotropy hypothesis is highlighted with a yellow background.
