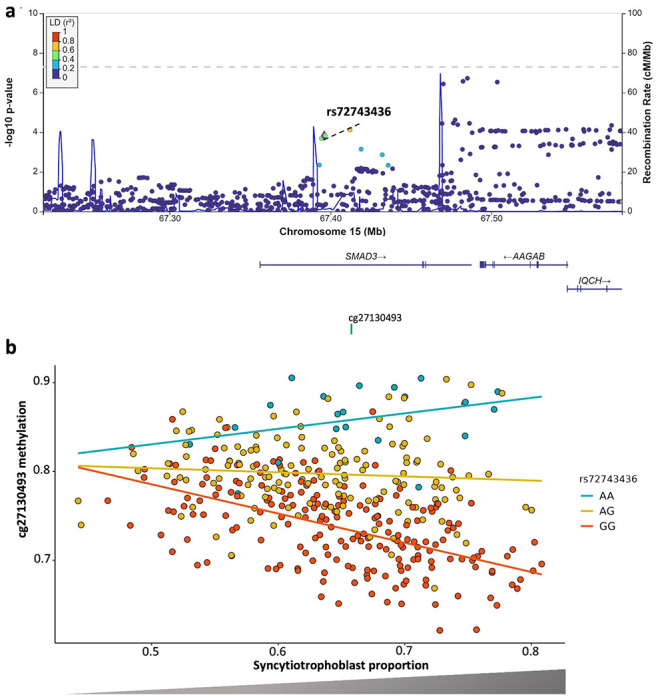
Figure 6. STB-imQTL pleiotropically associated with BIP.

The mQTL-SNP rs72743436, highlighted as a purple diamond, is shown in the original BIP GWAS in the a locusZoom plot. The X-axis displays the involved genomic region in chromosome 15 in Mb, showing the distribution of the coding genes in the locus, as well as the location of the mQTL-CpG cg27130493. The Y-axis shows the −log10 p-value from the original GWAS, and the SNPs are colour coded as a function of LD with the highlighted SNP. The STB-imQTL is pictured in the b dotplot. The X-axis represents the cg27130493 beta DNAm values and the Y-axis the STB proportion, both ranging from 0 to 1. The genotype of rs72743436 SNP-imQTL is colour coded as indicated in the legend.
