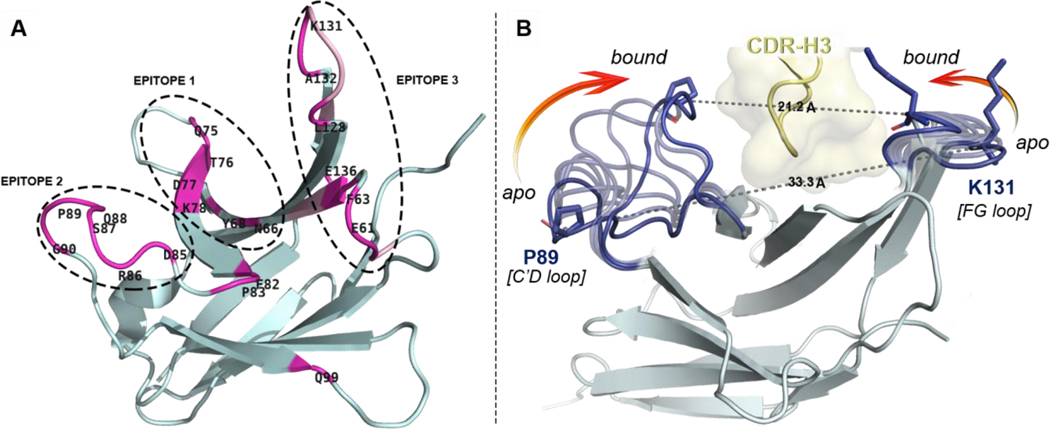
Figure 2.
Overview of distal PD1 epitopes mapping the binding interface with pembrolizumab and their motion upon binding. (A) Ribbon representation of PD1 with patches of contact residues (pink) forming the three epitopes. (B) Conformational motion of the C’D and FG loops creating a binding groove on PD1 around the pembrolizumab H3 loop (yellow). Overlay of 7 selected conformers (light blue) extracted from the conformational motion simulation with the central rigid core of PD1 (grey) showing both extreme open and closed conformations (dark blue). Pro89 and Lys131 on each edge of the receptor are represented to show the Cα–Cα distance closing the groove onto pembrolizumab. see morphing Supplementary Video S2.

