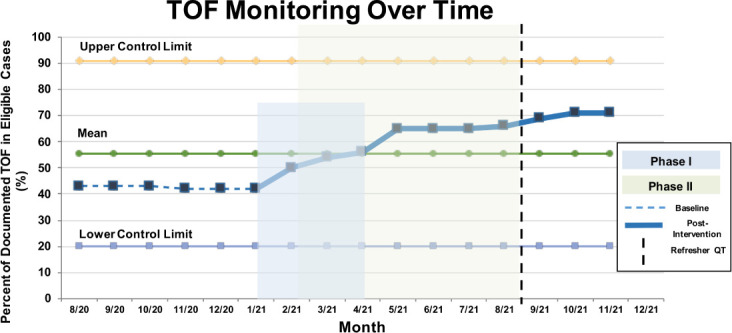
Figure 2.

Train of Four (TOF) monitoring rate over time. TOF monitoring rate increased from baseline (shown as the horizontal dashed line) over the course of Phase I (blue box) and Phase II (green box). The vertical dashed line depicts the time at which the Refresher QuizTime was implemented. The solid line depicts postintervention improvement in TOF, with continued increase after the Phase II was completed.
