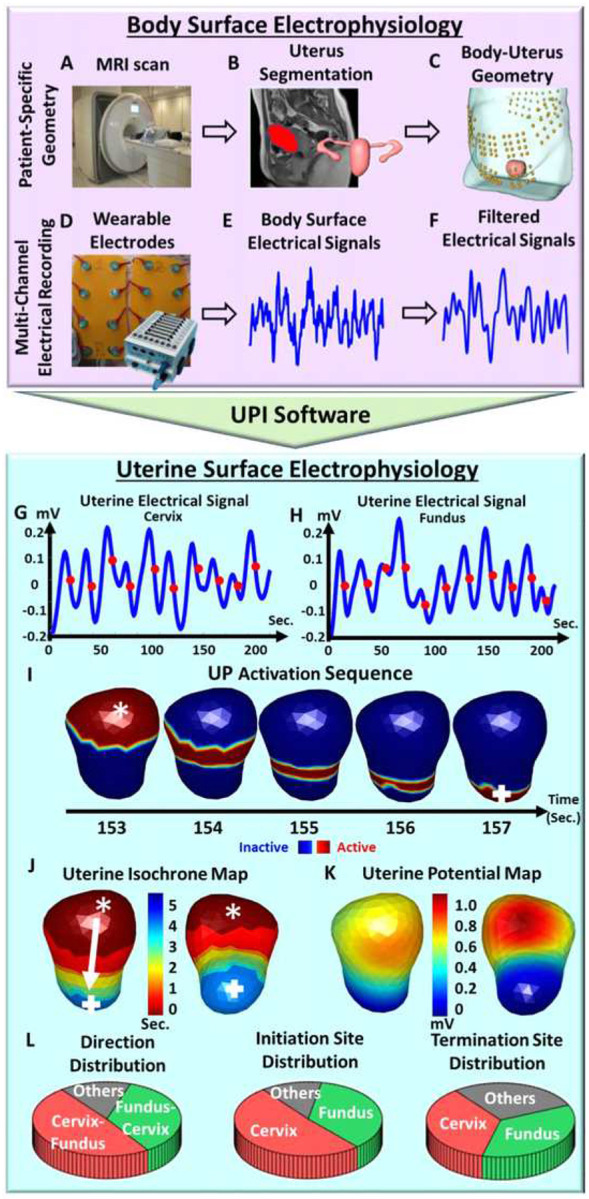
Figure 1.

Schematic of uterine peristalsis imaging. (A) A short anatomical MRI determining uterus-body surface geometry. (B) Segmentation of body surface, uterus surface, and fallopian tubes. (C) Patient specific body-uterus geometry. (D) Electrode patches were placed on the patient’s abdomen and back to record body surface electrical signals. (E) Electrical signal measurements on the patient’s body surface. (F) Filtered electrical signals (bandwidth: 0.01–0.1 Hz). (G) Uterine surface electrical signals from one uterine surface point around the fundal region (purple star in J, K, and L). Red dots denote the points of steepest negative slope to represent the activation times during peristalsis cycles. (H) Uterine surface electrical signals from one uterine surface point around the cervical region (green square in J, K, and L). (I) Detailed activation sequence of one complete uterine peristalsis cycle initiated near the fundus and terminated near the cervix. (J) Uterine isochrone maps from the same uterine peristalsis cycle. Warm and cool colors represent early and late activation, respectively. The white arrow depicts the peristalsis propagation direction. (K) One instant uterine potential map from the same uterine peristalsis cycle in I and J represents the potential distribution over the entire 3D uterine surface. (L) Distribution of uterine peristalsis direction (Cervix-Fundus, Fundus-Cervix, others), initiation and termination sites (cervix, fundus, and other areas) analyzed from one electrical mapping. The other three electrophysiological indices, such as magnitude, duration, and power of the uterine peristalsis, were also generated (see details in Materials and Methods)
