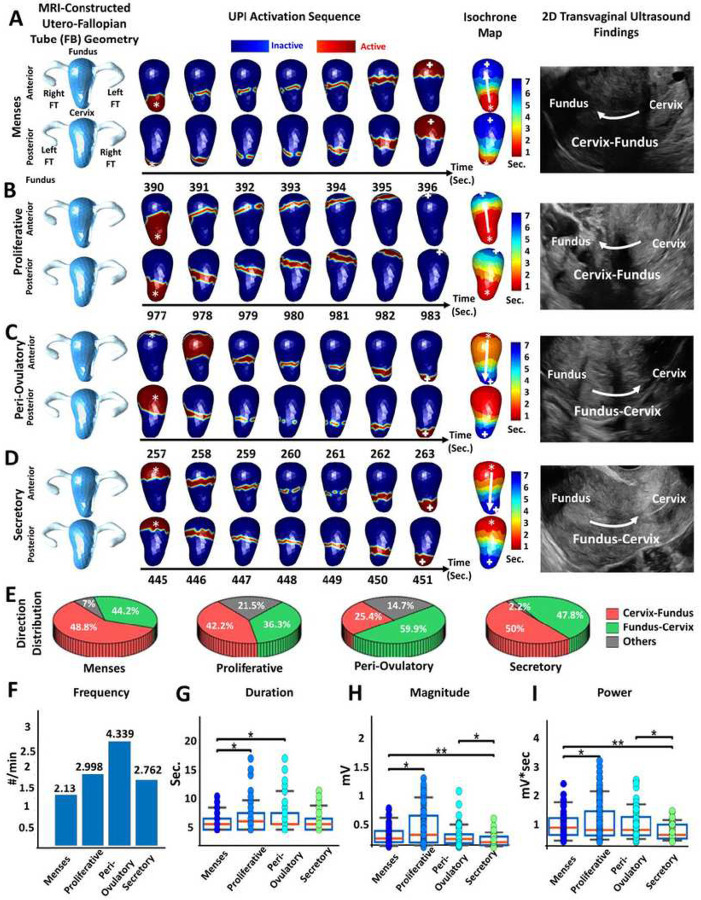
Figure 3.
Uterine peristalsis imaging in one participant with surgically confirmed endometriosis during four phases of the menstrual cycle. (A) Dominant Cervix-Fundus uterine peristalsis pattern during the menses phase;(B) Cervix-Fundus uterine peristalsis pattern during the proliferative phase; (C, D) Fundus-Cervix uterine peristalsis pattern during the (C) peri-ovulatory and (D) secretory phases; (E) Pie charts showing the uterine peristalsis direction distribution in each phase; (F) Bar plot of uterine peristalsis frequency (waves/min); (G,H,I) Boxplots of uterine peristalsis duration (downsampled to 1 Hz, seconds), magnitude (mV) and power (mV*sec) for all peristalsis waves in each phase (each dot represents one uterine peristalsis wave). In the UPI activation sequences and isochrone maps, the white asterisks indicate the peristalsis wave initiation sites, and the white arrows indicate the propagation directions. *P <0.05, **P<0.01

