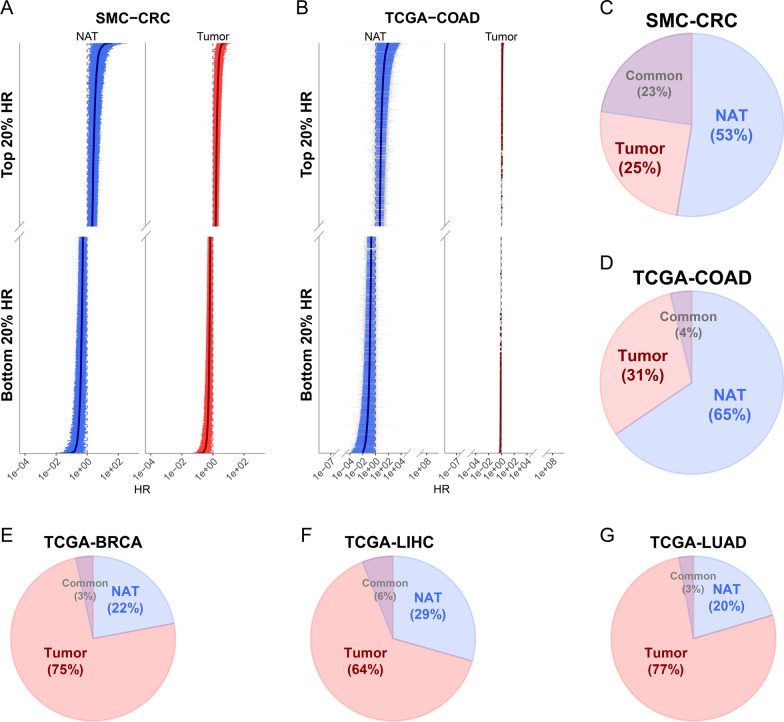
Fig. 6.
Comparison of proportions of survival-associated genes between NATs and tumors in different TCGA cancer types. A HR and the 95% CI of each gene from SMC-CRC samples are depicted. Only genes with top and bottom 20% HR in NATs (left panel) and tumors (right panel) are shown, respectively. Significant survival-associated genes (P < 0.05; Cox regression analysis) are colored blue for NAT and red for tumor. B Same as (A) but for TCGA-COAD samples. Note that 79 outlier genes with HR > 100 or HR < 0.01 in either NATs or tumors were removed. C–G Pie charts for the significant survival-associated genes (P-value < 0.05; Cox regression analysis) in (C) SMC-CRC, D TCGA-COAD, E TCGA-BRCA, F TCGA-LIHC, and G TCGA-LUAD are shown

