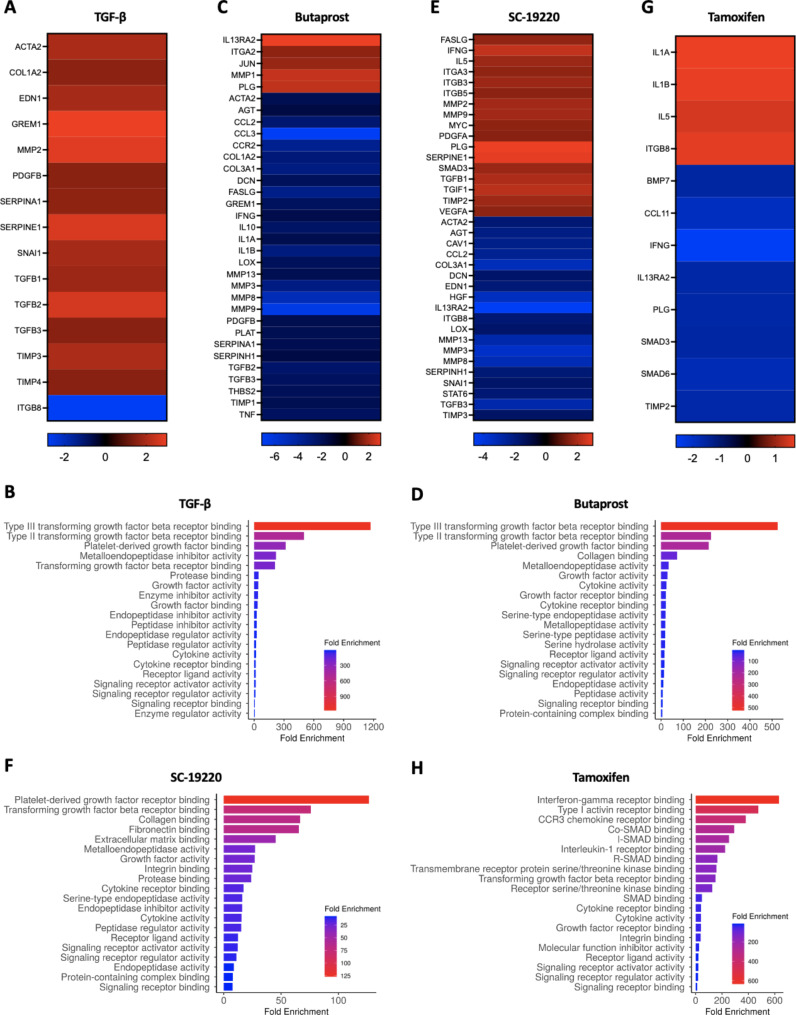
Fig. 2.
Gene and pathway analysis. Human PCKS were exposed to 10 ng/mL TGF-β for 48 h in the absence or presence of butaprost (50 µM), SC-19220 (225 µM) or tamoxifen (5 nM). Of note, tamoxifen was only present during the final 6 h. Next, gene expression was studied using Human Fibrosis RT2 Profiler PCR Arrays. (A) Heatmap showing the genes that were regulated more than 1.5-fold following TGF-β exposure. (B) Gene ontology analysis for molecular function ranked by fold enrichment. Heatmap showing the genes that were regulated more than 1.5-fold following (C) butaprost, (E) SC-19220 or (G) tamoxifen treatment compared to TGF-β exposed PCKS. Gene ontology analysis for molecular function ranked by fold enrichment for (D) butaprost, (F) SC-19220 or (H) tamoxifen treated slices compared to TGF-β exposed PCKS

