Fig. 3.
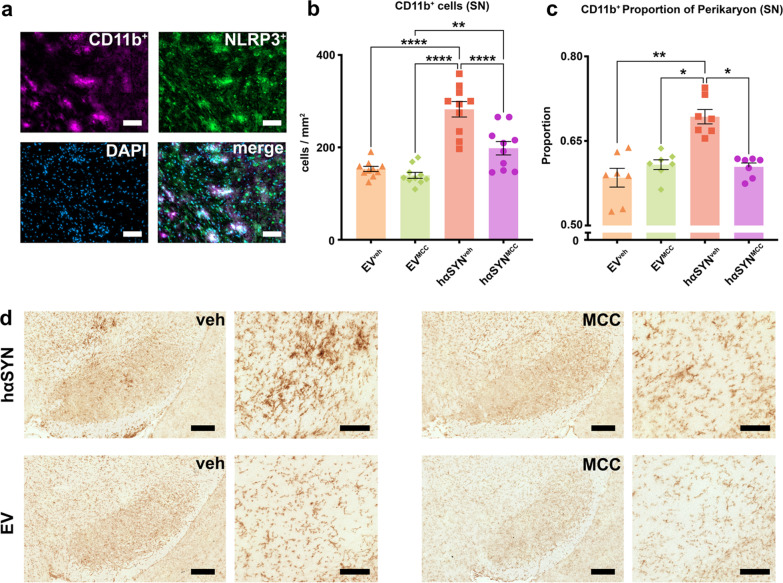
Reduced CD11b+ microglia activation in hαSYN mice after MCC950 treatment. a Immunofluorescence co-staining of NLRP3, CD11b, and DAPI in hαSYNveh mice. Scale bars = 50 µm. b Bar graph showing quantification of CD11b+ microglia in the substantia nigra (SN) of the different groups (n = 10). Statistical analysis by one-way ANOVA followed by Tukey’s multiple comparisons test: F(3,36) = 29.44, P < 0.0001. c Cell size indicated by the perikaryon to nucleus proportion of CD11b+ microglia (n = 7). Statistical analysis by Kruskal–Wallis test followed by Dunn’s multiple comparisons test: Kruskal–Wallis test = 15.83, four groups, P = 0.012. d immunohistochemical diaminobenzidine staining of 10 µm SN sections against CD11b. Scale bars: overview (left) = 250 µm, detail (right) = 100 µm. *P < 0.05, **P < 0.01, ***P < 0.001, ****P < 0.0001

