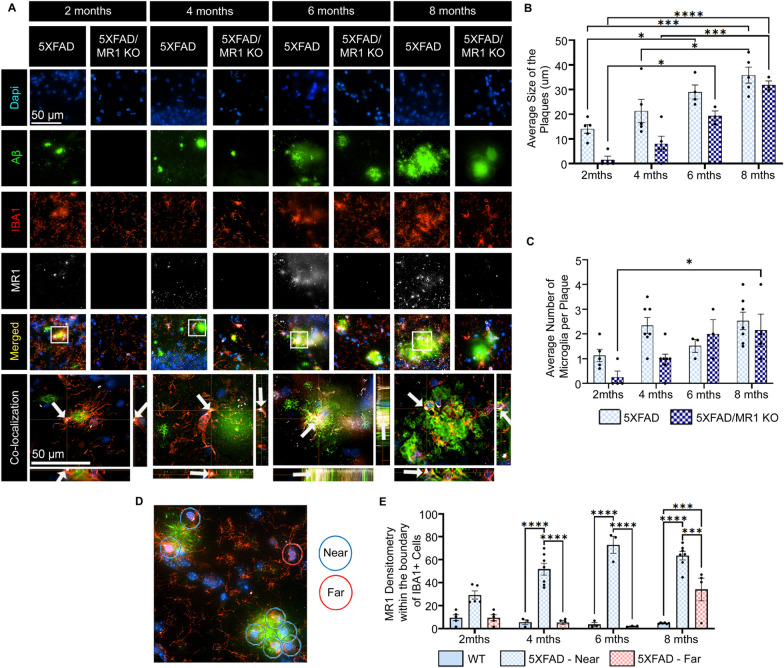
Fig. 4.
Temporal analysis of amyloid-beta (Aβ) plaques and microglia in 5XFAD vs. 5XFAD/MR1 KO mice. A Representative images showing Dapi (blue), IBA1-labeled microglia/macrophages (red), Aβ (green), MR1 (white), and the images merged, with co-localization of the boxed regions in the XY, ZX, and ZY planes (arrows). Scale bar = 50 µm. B The average diameter of Aβ plaques. C Average number of microglia visibly touching the Aβ plaques. D Representative image showing how microglia were determined to be near (blue circle) or far from plaques (red circle). E Densitometry analysis of the MR1 signal within the boundaries of the IBA1+ cells that were determined to be near (visibly touching) or far from Aβ plaques (no visible touching). Statistical analysis was performed using a two-way ANOVA with Tukey post hoc multiple comparison test. *P < 0.05, ***P < 0.001, ****P < 0.0001 (n = 3–7/group). The data are shown as the mean ± standard error of the mean

