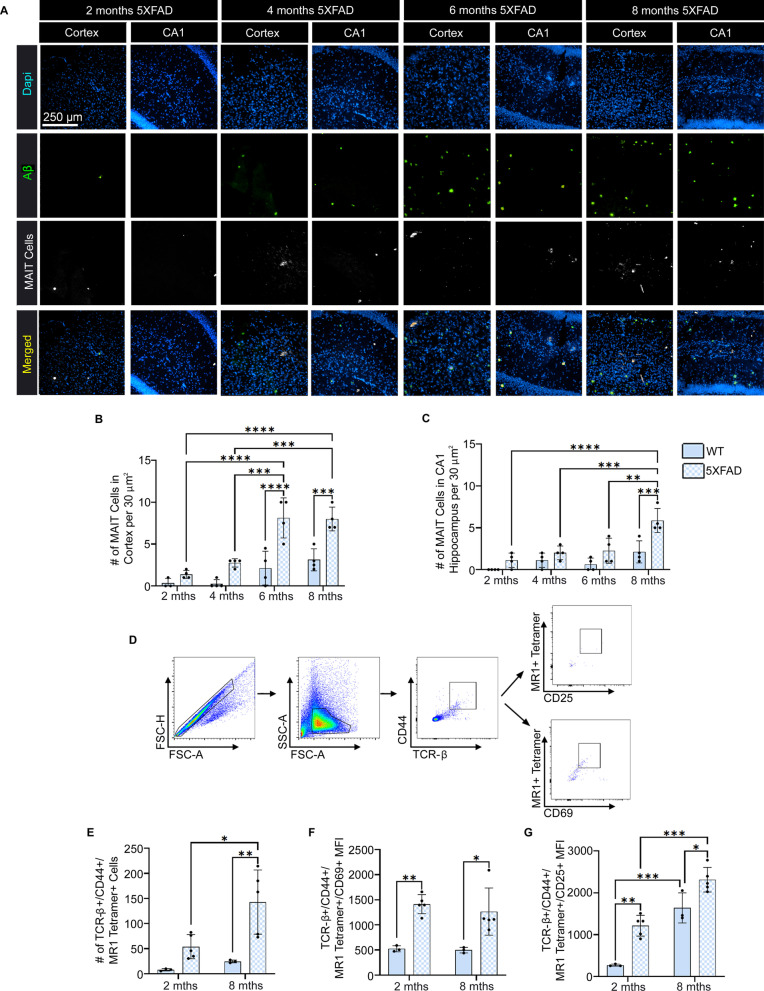
Fig. 5.
Temporal changes in the number of mucosal-associated invariant T (MAIT) cells in the brains of 5XFAD mice and their activation state. A Representative images showing Dapi (blue), amyloid-beta (Aβ) (green), MAIT cells (white), and the images merged. Scale bar = 250 µm. B, C Quantification of the number of MAIT cells in the temporal cortex (B) and CA1 region of the hippocampus (C). D Representative flow cytometry panels showing the gating strategy for the identification of MAIT cells (TCRβ+ CD44+ MR1 Tetramer+) and measurement of their activation state (CD69+ or CD25+). E Number of MAIT cells in the brain at 2 and 8 months of age. F, G Mean fluorescence intensity (MFI) of CD69 (F) and CD25 (G) expression on MAIT cells. Statistical analysis was performed using a two-way ANOVA with Tukey post hoc multiple comparison test. *P < 0.05, **P < 0.01, ***P < 0.001, ****P < 0.0001 (n = 3–4/group). The data are shown as the mean ± standard error of the mean

