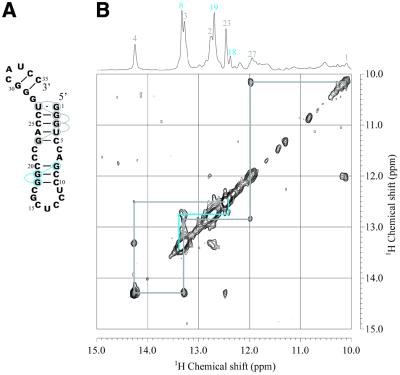
Figure 3.
Secondary structure (A) and NOESY spectrum (B) of Ea35 alone in the imino proton–imino proton region measured in 10 mM sodium phosphate, pH 6.5, 50 mM NaCl, 1 mM NaN3 containing 5% D2O at 25°C. The light blue lines indicate NOEs for the P3 stem and the gray lines for a stem formed through intra-strand association. The one-dimensional 1H spectrum and signal assignments are shown at the top.

