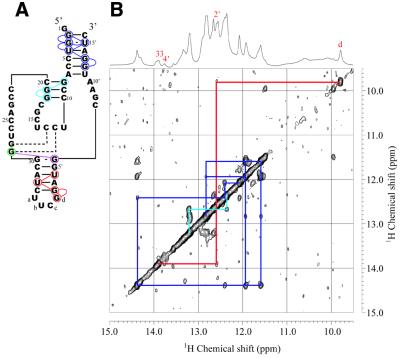
Figure 5.
Secondary structure (A) and NOESY spectrum (B) of the enzyme part of Rz-2 (E53, 1 mM) measured in 10 mM sodium phosphate buffer, pH 6.5, 50 mM NaCl containing 5% D2O at 25°C. Blue, light blue and red lines indicate NOE connectivities for the P2, P3 and P4 stems, respectively. The one-dimensional 1H spectrum and signal assignments are shown at the top.

