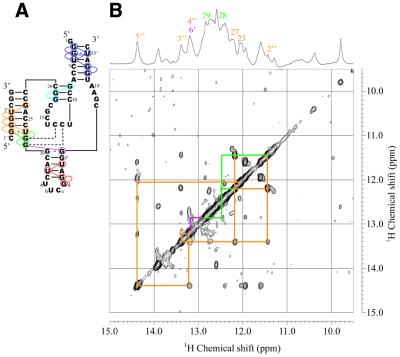
Figure 7.
Secondary structure (A) and NOESY spectrum (B) of the complete Rz-2 system (mS8:E53) measured in 10 mM sodium phosphate buffer, pH 6.5, 50 mM NaCl containing 5% D2O at 25°C. The sample contained a mixture of mS8 and E53 (1 mM each). Orange and green lines indicate NOE connectivities for the P1 and P1.1 stems, respectively. Purple lines indicate a NOE which can be assigned for that between G29 and G6′ of the G30:G6′ pair. The one-dimensional 1H spectrum and signal assignments for P1, P1.1 and G6′ are shown at the top.

