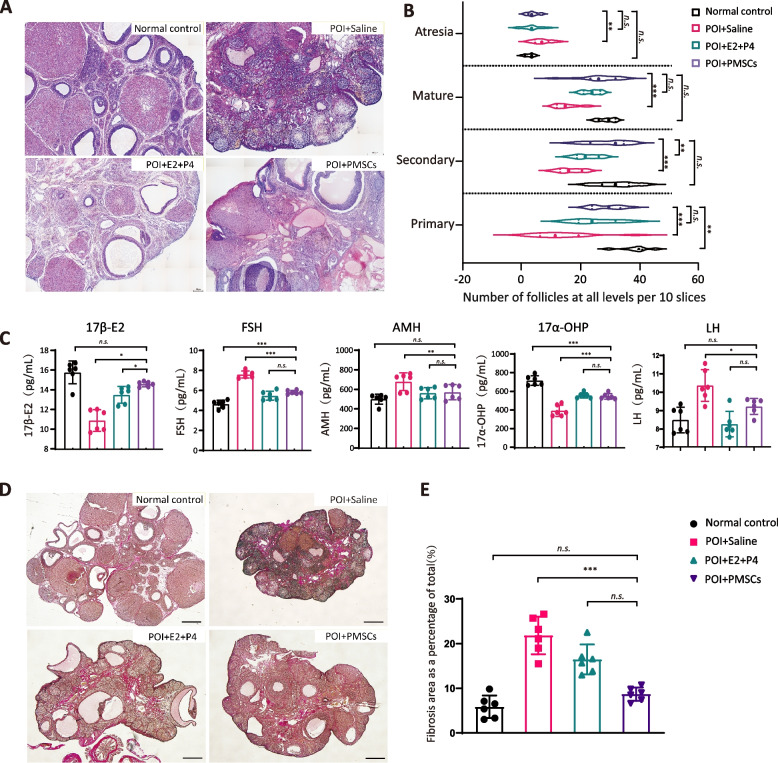
Fig. 3.
Therapeutic effects of PMSCs in a rat model of POI. A H&E staining of ovaries in the control and POI groups. Scale bar: 50 µm. B The number of follicles at different stages in each group. C AMH, E2, LH and FSH levels were significantly elevated in four groups. D The VG staining in each group. Scale bar: 200 μm. E Fibrosis levels were significantly elevated in four groups compared. Data are presented as the mean ± SD. *p < 0.05, **p < 0.01, ***p < 0.001, ns, not significant. Data are means of three independent experiments in each group. Data are presented as the mean ± SD. *p < 0.05, **p < 0.01, ***p < 0.001, ns, not significant. Data are means of three independent experiments in each group

