Fig. 5.
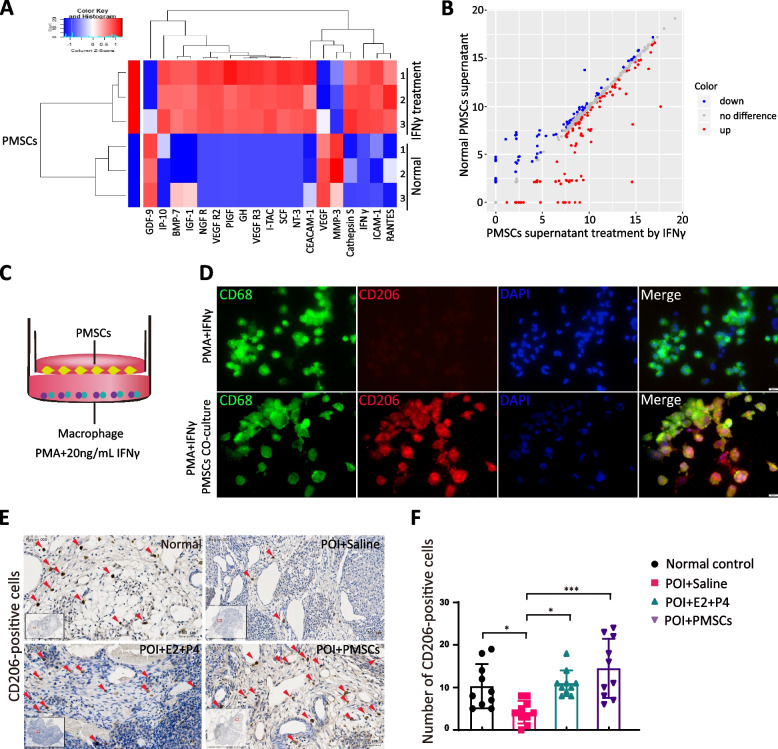
The number of M2 macrophages was increased by PMSCs in vitro and in vivo. A Cluster analysis by cytokine array showing the difference in paracrine factors of PMSCs after IFNγ-stimulation. B Volcano map. C Model of co-culture of macrophages and PMSCs. D Immunofluorescence analysis of macrophage phenotype, CD206, for M2 macrophages (red) and nuclear staining (blue). E The IHC staining of CD206 in each group rat ovary. Scale bar, 200 μm. F Quantification of macrophage phenotypes. The number of M2-like macrophages increased dramatically in the PMSCs group. Data are presented as the mean ± SD. *p < 0.05, **p < 0.01, ***p < 0.001, ns, not significant. Data are means of three independent experiments in each group

