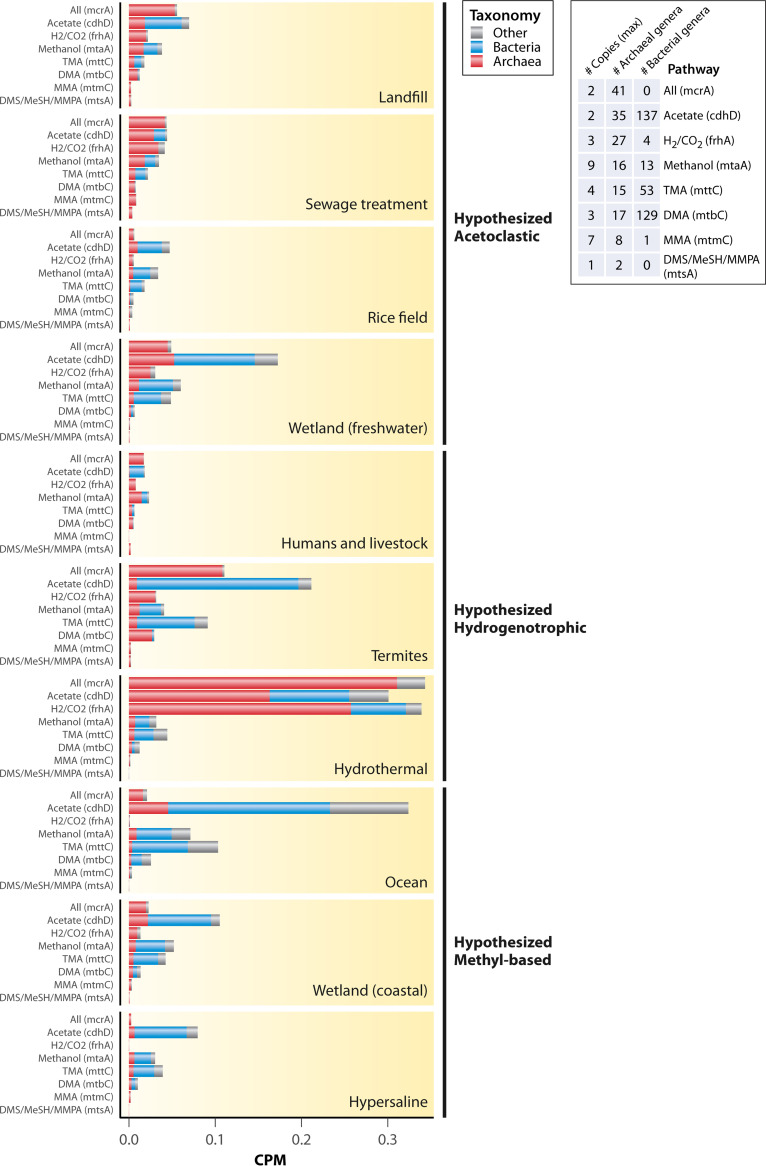
FIG 4.
Counts per million (CPM) assembled reads normalized abundance of genes for all core methanogenesis pathways (methyl-CoM reduction, mcrA), acetoclastic methanogenesis (cdhD), hydrogenotrophic methanogenesis (frhA), and methyl-based methanogenesis from methanol (mtaA), trimethylamine (mttC), dimethylamine (mtbC), methylamine (mtmC), or the methylated sulfides (mtsA), which include dimethylsulfide (DMS), methanethiol (MeSH), and methylthiopropanoate (MMPA). Gene counts are split taxonomically between archaea, bacteria, and other (eukaryotes and unassigned) according to the scaffold taxonomic assignments from the IMG/M annotation pipeline. Also shown are the number of copies of the genes in genomes containing the mcrA gene (methanogens), the number of archaeal genera containing the genes, and the number of bacterial genera containing the genes based on isolate genomes and high-quality MAGs in the IMG/M database. Note that “Humans and livestock” and “Termites” refer to gut samples. The following words were searched in IMG/M for each habitat type (the search was performed on February 5, 2022): landfill = “landfill”, sewage treatment = “sewage”, wetlands = “wetland”, rice fields = “rice”, ocean = “ocean”, humans and livestock = “human gut” or “ruminant” or “cow”, termites = “termite”, hydrothermal vents = “hydrothermal”, and hypersaline = “hypersaline.” The results were first filtered to only metagenomes (i.e., metatranscriptomes and isolate genomes were removed). Results were then further filtered based on the information in the study name or genome name to ensure that the metagenomes were actually from the targeted habitats, and only metagenomes containing the mcrA gene were retained. Coastal wetlands were separated from freshwater wetlands using “grep” to extract metagenomes containing the word “coastal” or based on our knowledge of the metagenomic study. Furthermore, only metagenomes with either unrestricted public use status or explicit permission from the principal investigators in the case of restricted use status for metagenomes sequenced at Joint Genome Institute (JGI) (JGI Data Utilization Status = “Restricted” in IMG/M) were used (Table S1 in the supplemental material). The KEGG Orthology (KO) gene counts were downloaded using the “Statistical Analysis” tool on IMG/M, which uses lastal 983 and KEGG Genes v77.1 to assign KO terms. To acquire KO gene counts of just the archaeal portion of the metagenomes, the KO profiles were filtered to include only those found on scaffolds assigned to the domain Archaea. The same was performed for the domain Bacteria. Archaeal and bacterial counts were subtracted from the total counts to yield the counts for all eukaryotic taxa as well as scaffolds with no taxonomic assignment. This was performed using a custom Python script to process three of the output files generated by the IMG/M annotation pipeline, (i) the KO terms of the genes, (ii) the taxonomic assignments of the scaffolds, and (iii) the gene to scaffold mapping. Metagenomes that contained fewer than 1,000 reads with family-level taxonomic information were removed from the data set. The final sample size was 465, including samples from all over the world (Fig. S2; landfill, n = 12; sewage treatment, n = 27; rice field, n = 11; wetlands (freshwater), n = 90; humans and livestock, n = 50; termites, n = 62; hydrothermal vent, n = 130; wetlands (coastal), n = 52; ocean, n = 13; hypersaline, n = 18). Correlations between the selected gene and the other genes in each pathway are shown in Fig. S3. Tables of all genomes containing each of these genes were downloaded from IMG/M to acquire counts of genera per domain that contain each gene. To aid in interpretation of abundances, we also downloaded a KO profile of all IMG/M isolate genomes and high-quality metagenome assembled genomes containing the mcrA gene (the search was performed May 11, 2022; n = 282 genomes), selected the genes of interest by their KOs, and examined the maximum and minimum number of copies across all of the genomes.

