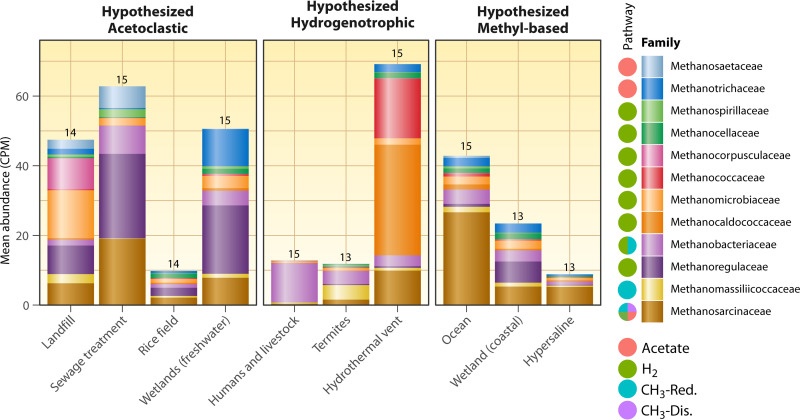
FIG 5.
Counts per million normalized abundance of different methanogen families across different methanogenesis habitats. Numbers above the columns are the number of methanogenic families present (the total number of methanogen families in the whole data set was 18). Also shown are the known substrates/pathways that can be used as published previously (39) but with the methyl-reducing pathway added to Methanosarcinaceae (69). Note that only the top 12 families in the data set are shown here (these families had greater than 1.6 CPM in at least one habitat type). Families are sorted by pathway and then by overall abundance. The data set was assembled as in Fig. 3, except a family-level taxonomic profile was downloaded with the “Statistical Analysis” tool on IMG/M, which uses lastal 983 and the IMG-NR reference database to assign the taxonomy. Methanogenic families were selected as those containing the string “Methano,” followed by filtering out any methanotrophs based on the literature. Known methanogenic pathways performed by the families were taken from the literature (39, 69).

