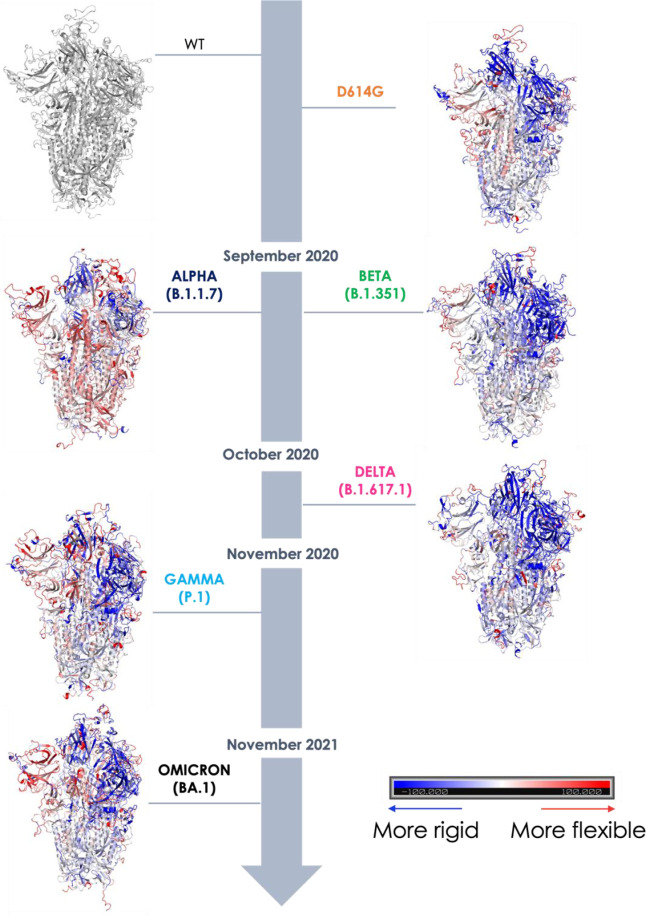
Figure 3.
Structural projection of flexibility differences with respect to the WT Wuhan mutant. Point-by-point subtraction of the DF matrix of the WT from the matrix of each variant. The larger the fluctuation value for each residue is for the variant with respect to the WT, the more the domain is colored red. Conversely, the lower the value is in the variant, the more the protein is colored blue: thus blue-colored domains represent areas that are stiffer overall, i.e., where coordination is greater, and this is clearly seen in the more stable variants (D614G, Beta, and Delta). The appearance of red areas reports on the lower coordination and therefore the greater flexibility of the variants (see Alpha, Gamma, and Omicron).

