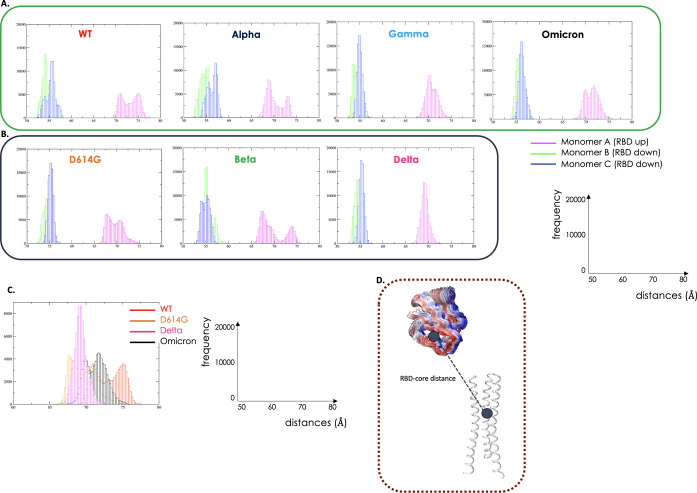
Figure 5.
Dynamics of RBD. UNSTABLE variants in green hues and STABLE variants in grey hues. (A) Distance between the COMs of the spike core and of the RBD of the UNSTABLE variants (WT, Alpha, Gamma, and Omicron) represented in histograms. Fluctuation of monomer A with the RBD in the UP position in magenta, monomer B (RBD down) in green, and monomer C (RBD down) in blue. (B) Distance between the COMs of the spike core and of the RBD of the STABLE variants (D614G, Beta, and Delta). The graphs report on the x-axis the distances (Å) and on the y-axis the frequencies. (C) In this panel, we report the comparison among the distances in the most representative variants (WT, D614G, Delta, and Omicron). (D) Structural representation reporting a simplified cartoon representation of the variable mentioned.

