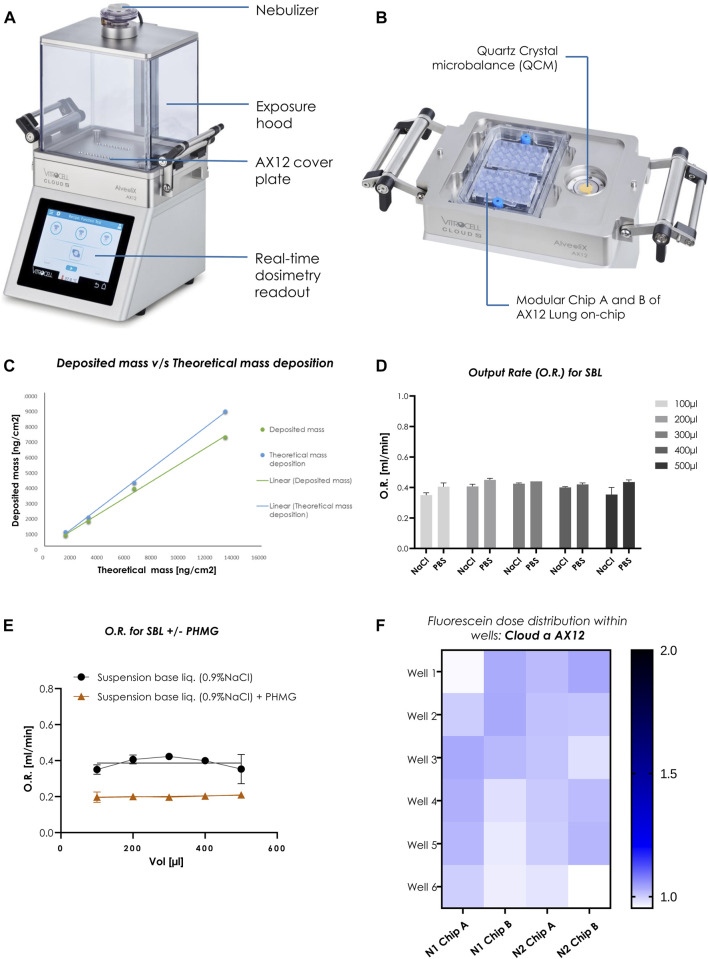
FIGURE 2.
Homogenous dose distribution using the Cloud α AX12 (A) Design of the Cloud α AX12 comprised of a stainless-steel base module maintained at 37°C containing the AX12 plate placed on top covered by a steel plate. The holes on the steel base-plate are aligned to the wells within the AX12 plate. The QCM 6 placed inside the polycarbonate removable exposure hood quantify real-time cell delivered dose and are recorded and analyzed with the Vitrocell software. The nebulizer on top relies on a piezoelectric vibrating mesh to form a consistent aerosol cloud from the solubilized substance nebulized. (B) Detailed closer inspection of the orientation and placement for the AX12 plate and the QCM 6 sensor. (C) Comparison between deposited mass as measured from the QCM 6 readings (in green) and theoretically calculated (in blue). (D) O.R. (mL/min) was measured for different volumes (100–500 µL) for two SBLs (0.9% NaCl in distilled water and 1% PBS in distilled water) (n = 3). Data shown as mean ± SEM. (E) PHMG compound was dissolved in NaCl suspension base liquid as a reference. O.R. was measured for SBL without and with compound dilution using the Cloud α AX12 (n = 3). (F) Dose distribution measured from fluorescence signals [A.U.] of nebulized Fluorescein deposited on-chip. Signals from each well depicted in color scheme (white to blue; low fluorescence signal to high) from two individual rounds in AX12 plates (N = 2; n = 12).

